IMAGE

Figure 6.

ID
ZDB-IMAGE-230916-239
Source
Figures for Nakamae et al., 2023
Image
Figure Caption

Figure 6.

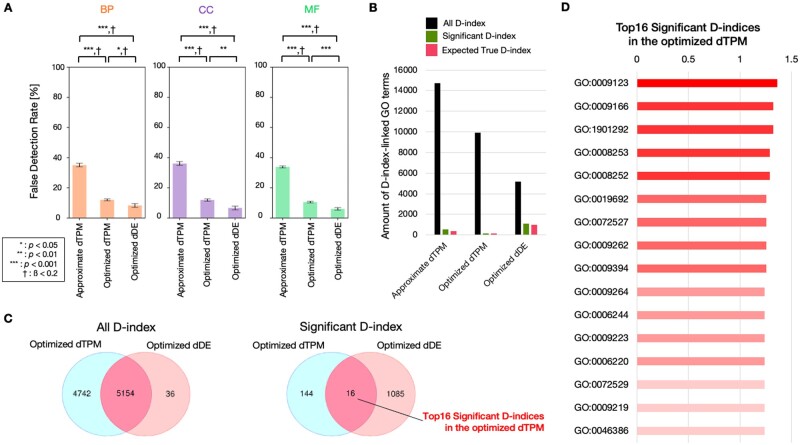
Evaluation of permutation test for DANGER analysis and comparison between dTPM and dDE. (A) Comparison of false detection rates among approximate dTPM (up to 11-MM NRR PAM, t = 0.4, L = 5E-1), optimized dTPM (up to 8-MM NGG PAM, t = 0.4, L = 1E-15), and optimized dDE (up to 8-MM NGG PAM, α = 0.001, L = 1E-15) in GO categories. BP, CC, and MF indicate GO categories of Biological Process, Cellular Component, and Molecular Function, respectively. Error bars represent SEM; asterisk indicates the statistical significance of two-sided Welch’s t-test; cross indicates statistical power (1-ß)>0.8. Mean±SD of n = 10 permutation data set. (B) Comparison of amount of GO terms of all D-index, significant D-index, and expected true D-index among approximate dTPM (up to 11-MM NRR PAM, t = 0.4, L = 5E-1), optimized dTPM (up to 8-MM NGG PAM, t = 0.4, L = 1E-15), and optimized dDE (up to 8-MM NGG PAM, α = 0.001, L = 1E-15), respectively. (C) Comparison of D-index and significant D-index between optimized dTPM and optimized dDE. A Venn diagram comparing the counts of D-index and significant D-index between optimized dTPM and optimized dDE. (D) The list of the top 16 significant D-indices in the optimized dTPM. The D-index values are indicated by bar graphs adjacent to the GO terms.

Acknowledgments
This image is the copyrighted work of the attributed author or publisher, and ZFIN has permission only to display this image to its users. Additional permissions should be obtained from the applicable author or publisher of the image. Full text @ Bioinform Adv