
Image
|
Figure Caption
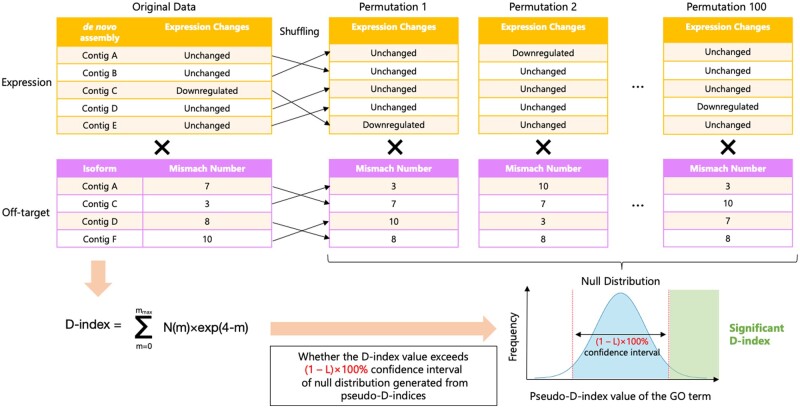
Figure 5.
A scheme for permutation testing to evaluate the validity of the D-index. The thin arrow indicates the manipulation of rearranging values from the original expression and off-target profile to the permutation data. The cross represents the computation for applying the D-index formula to the above expression profile and the below off-target profile data. The workflow is shown as the bold arrows.
Acknowledgments
This image is the copyrighted work of the attributed author or publisher, and
ZFIN has permission only to display this image to its users.
Additional permissions should be obtained from the applicable author or publisher of the image.
Full text @ Bioinform Adv