
- Title
-
Late fetal hematopoietic failure results from ZBTB11 deficiency despite abundant HSC specification
- Authors
- Cao, H., Naik, S.H., Amann-Zalcenstein, D., Hickey, P., Salim, A., Cao, B., Nilsson, S.K., Keightley, M.C., Lieschke, G.J.
- Source
- Full text @ Blood Adv
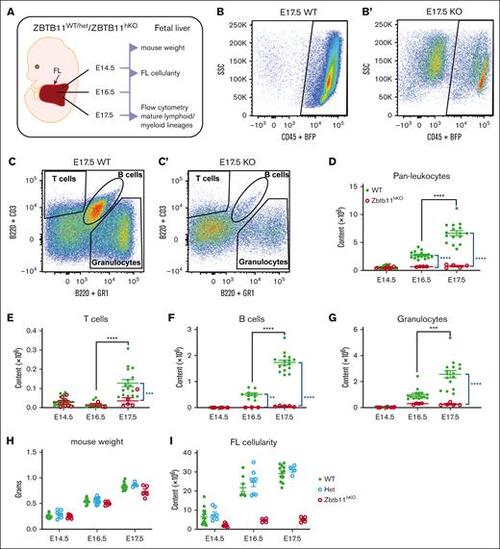
Homozygous Zbtb11 inactivation in the fetal hematopoietic compartment drastically impairs FL mature lymphoid and myeloid output. (A) Schematic description of the analysis. Flow cytometry analysis of FL at E17.5: dot plots showing the representative incidence of (B/B′) pan leukocytes (CD45+); (C/C′) granulocytes (Gr1+), T cells (CD3+), and B cells (B220+). Scatter plots showing the absolute quantification of total content at E14.5, E16.5, and E17.5: (D) CD45+ leukocytes, (E) T cells, (F) B cells, and (G) granulocytes. Mouse embryo weight (H) and FL cellularity (I) showed no haploinsufficiency effect in heterozygotes. For panels D and G: E14.5 WT, n = 22 and KO, n = 7; E16.5 WT, n = 16 and KO, n = 4; E17.5 WT, n = 16 and KO, n = 5. For panels E and F: E14.5 WT, n = 22 and KO, n = 7; E16.5 WT, n = 9 and KO, n = 3; E17.5 WT, n = 16 and KO, n = 5. For panel H: E14.5 WT, n = 15, Het, n = 7, and KO n = 7; E16.5 WT, n = 10, Het, n = 12, and KO, n = 5; E17.5 WT, n = 12, Het, n = 4, and KO n = 4. For panel I: E14.5 WT, n = 15, Het, n = 7, and KO, n = 7; E16.5 WT, n = 8, Het, n = 8, and KO, n = 4; E17.5 WT, n = 12, Het, n = 4, and KO n = 5. WT/controls; (green); KO, Zbtb11hKO (red); Het, Zbtb11WT/hKO (blue); data ± standard error of the mean. Two-way analysis of variance with Tukey (black) or Šídák (blue) multiple comparisons: ∗∗P < .01; ∗∗∗P < .001; ∗∗∗∗P < .0001. |
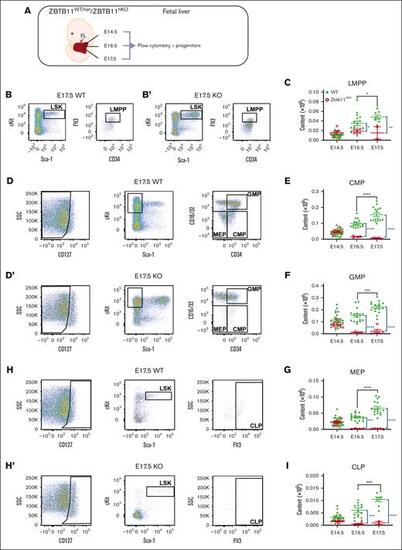
In the absence of Zbtb11, FL-committed progenitor numbers fail to increase. (A) Schematic description of the analysis. Flow cytometry analysis dot plots show representative incidence at E17.5: (B/B′) LMPP (LSKCD34+Flt3+); (D/D′) CMP (Lin−CD127−Sca-1−c-Kit+CD34+CD16/32−), GMP (Lin−CD127−Sca-1−c-Kit+CD34+CD16/32+), and MEP (Lin−CD127−Sca-1−c-Kit+CD34−CD16/32−); and (H/H′) CLP (Lin−CD127+Sca-1+cKit+Flt3+). Scatter plots showing the absolute quantification of total content at E14.5, E16.5, and E17.5: (C) LMPP, (E) CMP, (F) GMP, (G) MEP, and (I) CLP. For panels C and I: E14.5 WT, n = 22 and KO n = 7; E16.5 WT, n = 16 and KO n = 4; E17.5 WT, n = 8 and KO n = 2. For panels E-G: E14.5 WT, n = 22 and KO, n = 7; E16.5 WT, n = 16 and KO, n = 4; E17.5 WT, n = 16 and KO, n = 5. WT/controls (green); KO, Zbtb11hKO (red); data ± standard error of the mean. Two-way analysis of variance with Tukey (black) or Šídák (blue) multiple comparisons: ∗P < .05; ∗∗P < .01; ∗∗∗P < .001; ∗∗∗∗P < .0001. CLP, common lymphoid progenitor; GMP, granulocyte–macrophage progenitor; LMPP, lymphoid-primed multipotent progenitor; MEP, myeloerythroid progenitor. |
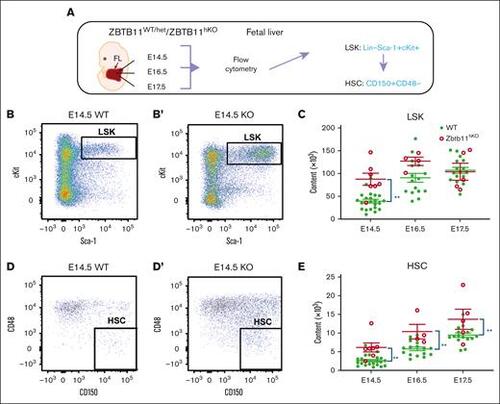
Multipotent Zbtb11hKO progenitors and HSCs are elevated in the FL. (A) Schematic description of the analysis and definition of HSC used in all experiments. Flow cytometry analysis: (B/B′) HSC progenitors (LSK) and (D/D′) HSC (LSKCD150+CD48−) at E14.5, with dot plots showing the representative incidence. Scatter plots showing the absolute quantification at E14.5, E16.5, and E17.5: (C) total LSK (E14.5: Zbtb11hKO = 8.7 × 10⁴ (n = 7); controls = 3.9 × 10⁴ [n = 22]; P = .0011), and (E) total HSC at E14.5 (Zbtb11hKO = 6.1 × 10³ [n = 7]; controls = 2.6 × 10³ [n = 22]; P = .0072), E16.5 (Zbtb11hKO = 10.4 × 10³ [n = 4]; controls = 5.7 × 10³ [n = 16]; P = .0062), and E17.5. (Zbtb11hKO =13.7 × 10³ [n = 5]; controls = 9.4 × 10³ [n = 16]; P = .0061). WT/controls (green); KO, Zbtb11hKO (red); data ± standard error of the mean. Two-way analysis of variance with Šídák multiple comparisons: ∗∗P < .01. |
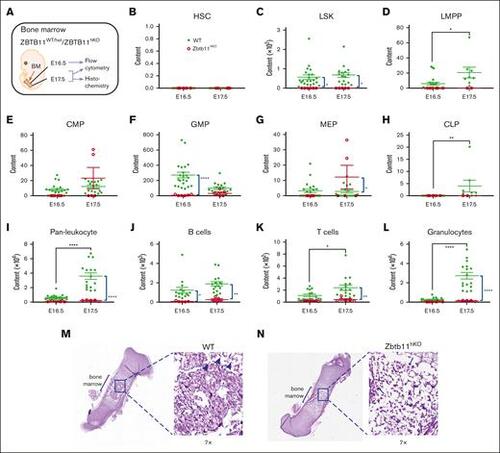
The absence of Zbtb11 in the hematopoietic compartment results in fetal BM failure. (A) Schematic description of the analysis. Scatter plots showing absolute quantification of total BM content at E16.5 and E17.5: (B) HSC, (C) LSK, (D) LMPP, (E) CMP, (F) GMP, (G) MEP (H), CLP, (I) pan leukocytes, (J) B cells, (K) T cells, and (L) granulocytes at E16.5 and E17.5. For panels B, C, E, F, G, I, and L: E16.5 WT, n = 22 and KO, n = 6; E17.5 WT, n = 16 description of the KO, n = 5. For panels D and H: E16.5 WT, n = 22 and KO, n = 6; E17.5 WT, n = 8 and KO, n = 2; For panels J and K: E16.5 WT, n = 15 and KO, n = 5; E17.5 WT, n = 16 and KO, n = 5. Hematoxylin and eosin staining of E17.5 femur sections for (M) WT and (N) Zbtb11hKO. Insets are original magnification ×7 of boxed area. Arrowheads indicate enucleated erythroid cells (M), and arrows indicate nucleated erythroid cells (N). WT, wild-type controls (green); KO, Zbtb11hKO (red); E, embryonic day; Data ± standard error of the mean. Two-way analysis of variance with Šídák multiple comparisons: ∗P < .05; ∗∗P < .01; ∗∗∗∗P < .0001. |
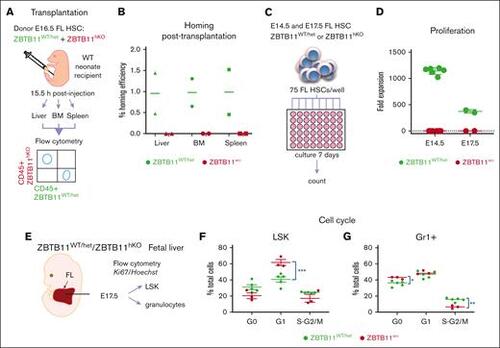
Functional failure of Zbtb11hKO HSC: failure to home after transplantation, failure to proliferate in vitro, and impairment of cell cycle progression. (A) Schematic description of the transplantation and homing analysis. (B) Homing efficiency of E16.5 Zbtb11hKO and WT FL HSCs transplanted into WT neonate. (C) Schematic description of the in vitro proliferation assay in which 75 immunophenotyped Zbtb11hKO or WT FL HSCs were seeded per well and cultured in growth medium. Cells were counted in each well on day 7 and divided by 75 to determine the fold expansion. (D) Flow cytometry quantification of in vitro proliferation assays: on day 7, E14.5 HSC culture resulted in mean = 133 Zbtb11hKO cells and 85 078 control cells, respectively; the average fold expansion was 1.78 and 1142.7 over initial seeding of 75 cells. (E) Schematic description of the cell cycle analysis. Cell cycle progression was assessed using the Ki67/nuclear DNA (Hoechst) ratio for (F) LSK and (G) granulocytes (Gr1+) at E17.5. For panel B, n = 2 independent experiments. For panel D: E14.5 WT, n = 6 and KO, n = 6; E17.5 WT, n = 2 and KO, n = 2. For panels F and G: WT, n = 5 and KO, n = 3; WT/controls (green); KO, Zbtb11hKO (red); data ± standard error of the mean. Two-way analysis of variance with Šídák multiple comparisons: ∗P < .05; ∗∗P < .01; ∗∗∗P < .001. |

scRNAseq analysis of WT and Zbtb11hKO HSCs reveals underrepresentation of Zbtb11hKO HSCs in the cluster characterized by an erythroid signature and dysregulation of niche gene expression. (A) Distribution of cells based on the number, proportion (%), and genotype for each cluster. Clusters 1 and 3 are disproportionately comprised of WT cells, whereas clusters 0 and 4 are disproportionately comprised of KO cells. (B) Uniform Manifold Approximation and Projection plot of unsupervised clustering identified 5 subpopulations of E14.5 FL HSCs (LSK/SLAM). (C) Heatmap of normalized log-expression values for the top 10 cluster-specific marker genes. Column colors represent the cluster identity to which each cell is assigned. (D) Distribution of cell cycle phase within each cluster. (E) Enrichment of log normalized gene expression of top 10 upregulated genes in each cluster was evaluated across individual hematopoietic lineages defined using the Haemopedia Mouse RNAseq data set, which contains 129 samples classified into 13 cell lineages and 57 cell types.46 Expression of marker genes for cluster 1 shows enrichment for erythrocyte lineage (boxed) genes. (F) Differential expression of hematopoietic niche genes in unclustered E14.5 FL Zbtb11hKO HSCs compared with WT HSCs. Y-axis shows the log2FC (fold change) gene expression level, with a false discovery rate < 0.05. Mean fluorescence intensity (MFI) of c-Kit (G) and Flt3 (H) protein in Zbtb11hKO and WT control progenitors at E14.5. WT/controls (green); KO, (red); fluorescence intensity of the protein is shown along the y-axis; data ± standard error of the mean. Two-way analysis of variance with Šídák multiple comparisons: ∗∗∗∗P < .0001. |