
Fig. 3
- ID
- ZDB-FIG-240131-21
- Publication
- Cao et al., 2023 - Late fetal hematopoietic failure results from ZBTB11 deficiency despite abundant HSC specification
- Other Figures
- All Figure Page
- Back to All Figure Page
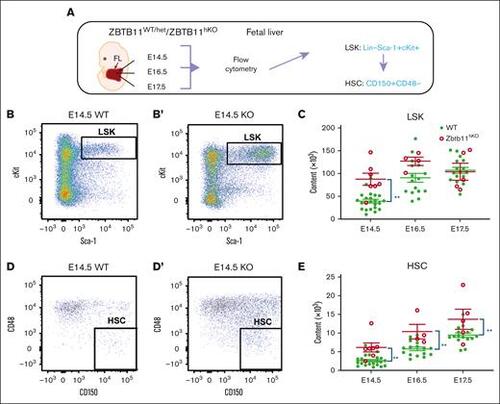
Multipotent Zbtb11hKO progenitors and HSCs are elevated in the FL. (A) Schematic description of the analysis and definition of HSC used in all experiments. Flow cytometry analysis: (B/B′) HSC progenitors (LSK) and (D/D′) HSC (LSKCD150+CD48−) at E14.5, with dot plots showing the representative incidence. Scatter plots showing the absolute quantification at E14.5, E16.5, and E17.5: (C) total LSK (E14.5: Zbtb11hKO = 8.7 × 10⁴ (n = 7); controls = 3.9 × 10⁴ [n = 22]; P = .0011), and (E) total HSC at E14.5 (Zbtb11hKO = 6.1 × 10³ [n = 7]; controls = 2.6 × 10³ [n = 22]; P = .0072), E16.5 (Zbtb11hKO = 10.4 × 10³ [n = 4]; controls = 5.7 × 10³ [n = 16]; P = .0062), and E17.5. (Zbtb11hKO =13.7 × 10³ [n = 5]; controls = 9.4 × 10³ [n = 16]; P = .0061). WT/controls (green); KO, Zbtb11hKO (red); data ± standard error of the mean. Two-way analysis of variance with Šídák multiple comparisons: ∗∗P < .01. |