
|
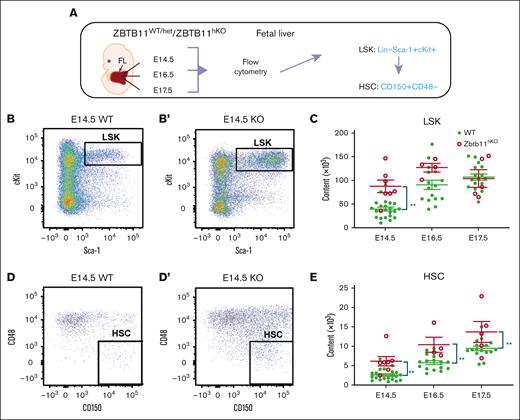
Fig. 3 Multipotent Zbtb11hKO progenitors and HSCs are elevated in the FL. (A) Schematic description of the analysis and definition of HSC used in all experiments. Flow cytometry analysis: (B/B′) HSC progenitors (LSK) and (D/D′) HSC (LSKCD150+CD48−) at E14.5, with dot plots showing the representative incidence. Scatter plots showing the absolute quantification at E14.5, E16.5, and E17.5: (C) total LSK (E14.5: Zbtb11hKO = 8.7 × 10⁴ (n = 7); controls = 3.9 × 10⁴ [n = 22]; P = .0011), and (E) total HSC at E14.5 (Zbtb11hKO = 6.1 × 10³ [n = 7]; controls = 2.6 × 10³ [n = 22]; P = .0072), E16.5 (Zbtb11hKO = 10.4 × 10³ [n = 4]; controls = 5.7 × 10³ [n = 16]; P = .0062), and E17.5. (Zbtb11hKO =13.7 × 10³ [n = 5]; controls = 9.4 × 10³ [n = 16]; P = .0061). WT/controls (green); KO, Zbtb11hKO (red); data ± standard error of the mean. Two-way analysis of variance with Šídák multiple comparisons: ∗∗P < .01.