
Fig. 1
- ID
- ZDB-FIG-240131-19
- Publication
- Cao et al., 2023 - Late fetal hematopoietic failure results from ZBTB11 deficiency despite abundant HSC specification
- Other Figures
- All Figure Page
- Back to All Figure Page
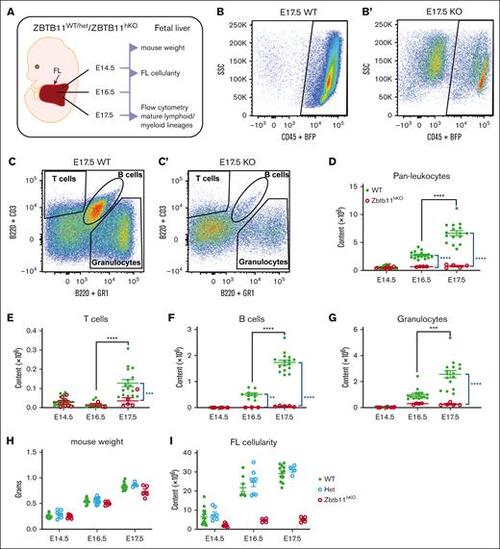
Homozygous Zbtb11 inactivation in the fetal hematopoietic compartment drastically impairs FL mature lymphoid and myeloid output. (A) Schematic description of the analysis. Flow cytometry analysis of FL at E17.5: dot plots showing the representative incidence of (B/B′) pan leukocytes (CD45+); (C/C′) granulocytes (Gr1+), T cells (CD3+), and B cells (B220+). Scatter plots showing the absolute quantification of total content at E14.5, E16.5, and E17.5: (D) CD45+ leukocytes, (E) T cells, (F) B cells, and (G) granulocytes. Mouse embryo weight (H) and FL cellularity (I) showed no haploinsufficiency effect in heterozygotes. For panels D and G: E14.5 WT, n = 22 and KO, n = 7; E16.5 WT, n = 16 and KO, n = 4; E17.5 WT, n = 16 and KO, n = 5. For panels E and F: E14.5 WT, n = 22 and KO, n = 7; E16.5 WT, n = 9 and KO, n = 3; E17.5 WT, n = 16 and KO, n = 5. For panel H: E14.5 WT, n = 15, Het, n = 7, and KO n = 7; E16.5 WT, n = 10, Het, n = 12, and KO, n = 5; E17.5 WT, n = 12, Het, n = 4, and KO n = 4. For panel I: E14.5 WT, n = 15, Het, n = 7, and KO, n = 7; E16.5 WT, n = 8, Het, n = 8, and KO, n = 4; E17.5 WT, n = 12, Het, n = 4, and KO n = 5. WT/controls; (green); KO, Zbtb11hKO (red); Het, Zbtb11WT/hKO (blue); data ± standard error of the mean. Two-way analysis of variance with Tukey (black) or Šídák (blue) multiple comparisons: ∗∗P < .01; ∗∗∗P < .001; ∗∗∗∗P < .0001. |