
- Title
-
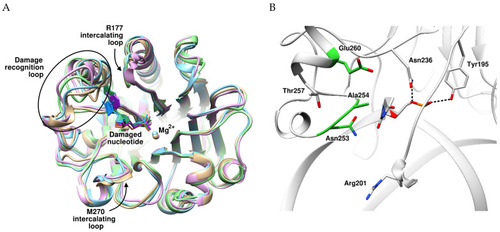
Inner Amino Acid Contacts Are Key Factors of Multistage Structural Rearrangements of DNA and Affect Substrate Specificity of Apurinic/Apyrimidinic Endonuclease APE1
- Authors
- Bulygin, A.A., Syryamina, V.N., Kuznetsova, A.A., Novopashina, D.S., Dzuba, S.A., Kuznetsov, N.A.
- Source
- Full text @ Int. J. Mol. Sci.
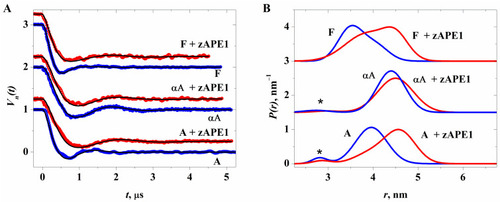
( |
( |
( |
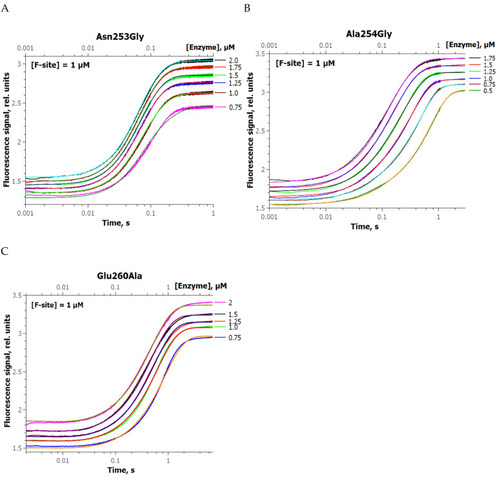
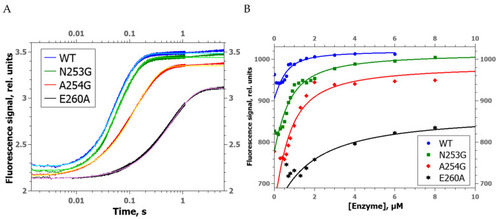
Changes in the FRET signal during the interaction of zAPE1 N253G ( |
( |
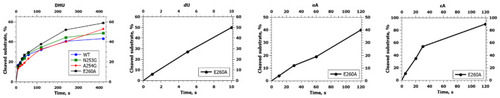
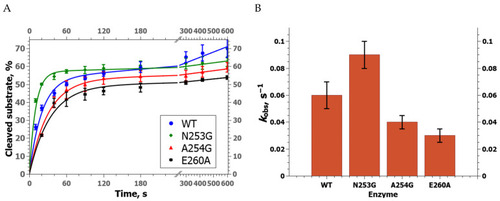
Kinetic curves of product accumulation in the course of cleavage of NIR substrates by zAPE1 E260A under steady-state conditions. [E] = 2.0 μM, [S] = 1.0 μM. |
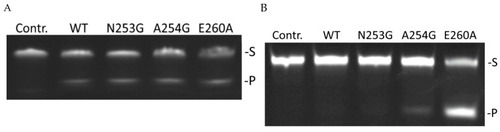
Polyacrylamide gel electrophoresis (PAGE) analysis of product accumulation under the action of zAPE1 enzymes after 40 s for the DHU-substrate ( |
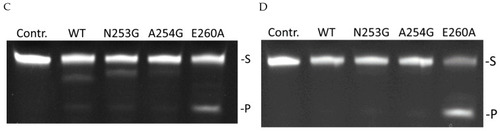
Polyacrylamide gel electrophoresis (PAGE) analysis of product accumulation under the action of zAPE1 enzymes after 40 s for the DHU-substrate ( |
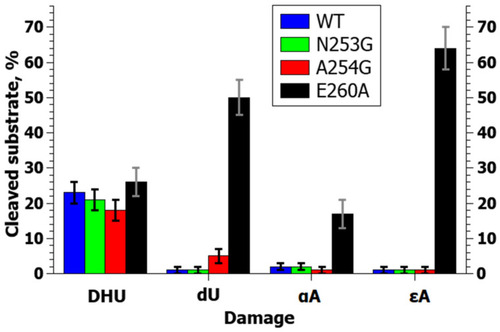
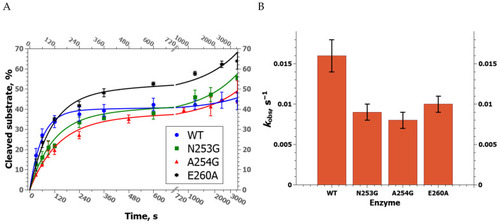
Efficiency of NIR substrate cleavage by zAPE1 mutants under selected conditions. In this case, the whiskers define the interval in which the results of different repetitions of the experiment lie. |
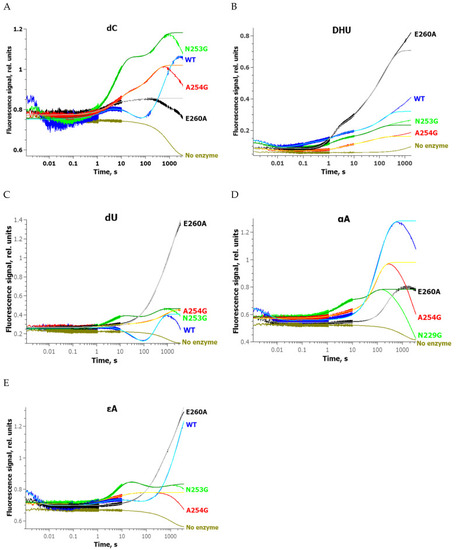
Changes of the FRET signal during the interaction of zAPE1 enzymes with undamaged DNA ( |
( |