
Image
|
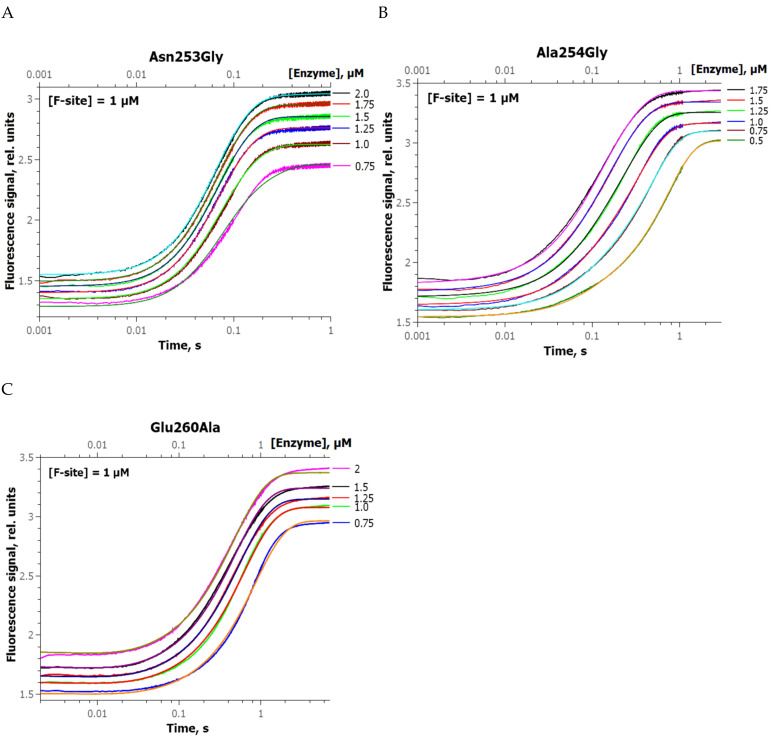
Figure Caption
Figure 4
Changes in the FRET signal during the interaction of zAPE1 N253G (
Acknowledgments
This image is the copyrighted work of the attributed author or publisher, and
ZFIN has permission only to display this image to its users.
Additional permissions should be obtained from the applicable author or publisher of the image.
Full text @ Int. J. Mol. Sci.