Effects of parental treatment on zebrafish offspring cumulative mortality and cumulative hatch. (A) Cumulative mortality; (B) cumulative hatch. Offspring were derived from adult zebrafish exposed to either control or combined exposure conditions for 14 days. Statistical differences between values were determined with Kruskal–Wallis one-way ANOVAs followed by Tukey post hoc tests [across developmental time (dpf); A: control: P=0.485; combined exposure: P=0.005; B: control: P<0.001; combined exposure: P<0.001], and between parental treatments with Mann–Whitney rank sum tests (A: 8 hpf: P=0.250; 1 dpf: P=0.034; 2 dpf: P=0.041; 3 dpf: P=0.060; 4 dpf: P=0.060; 5 dpf: P=0.060; B: 0 dpf: P=1.000; 1 dpf: P=0.342; 3 dpf: P=0.040; 4 dpf: P=1.000; 5 dpf: P=1.000) or two-tailed t-tests (B: 2 dpf: P<0.001). Assessment of each treatment group was performed at the same developmental time but are presented offset for presentation clarity. Values within a given treatment that do not share a common letter are different from one another. Differences between treatments for a given developmental time are indicated by an asterisk. Data are means±s.e.m. (n=20 for each time point for both treatments, for both graphs).

Effects of parental treatment on zebrafish embryo endocrine stress response. (A) Cortisol levels and (B) hsd11b2, hsd20b2 and abcb4 relative gene expression of ∼1 h post-fertilization (hpf) embryos derived from adult zebrafish exposed to either control or combined exposure conditions for 14 days. Cortisol levels were compared with a Mann–Whitney rank sum test (P=0.041). The gene expression values were normalized to the geometric mean of ef1α and rpl13a and the expression ratio for each gene is presented relative to the control treatment. Statistical differences between values were determined by two-tailed t-tests (hsd11b2: P=0.965; hsd20b2: P=0.002; abcb4: P=0.003). Differences between treatments for a given parameter are indicated by an asterisk. Data are medians and interquartile ranges in A and means±s.e.m. in B (hsd11b2, hsd20b2 and abcb4, n=5–7; cortisol, n=6).

Effects of parental treatment on zebrafish larvae cortisol stress response. Cortisol levels after a 20 min exposure to (A) combined elevated temperature and hypoxia (offspring combined exposure), (B) a swirling stressor (offspring swirl) or control conditions (offspring control) in 5 days post-fertilization (dpf) larvae derived from adult zebrafish exposed to either control or combined exposure conditions for 14 days. Cortisol levels were compared with two-way ANOVAs followed by post hoc Holm–Šidák tests (A: square-root transformed, parental exposure: P=0.014; larval exposure: P=0.002; parental exposure×larval exposure: P=0.205; B: parental exposure: P=0.973; larval exposure: P<0.001; parental exposure×larval exposure: P=0.374). Differences within treatments across exposure at 5 dpf are indicated by different letters. Differences between treatments for a given exposure at 5 dpf are indicated by an asterisk. Data are means±s.e.m. (all n=6; except combined exposure larvae, swirl, where n=5).

Effects of parental treatment on zebrafish larvae endocrine stress gene expression. (A) hsd11b2 and (B) hsd20b2 relative gene expression of control (offspring control) or post-exposure to combined elevated temperature and hypoxia (offspring combined exposure) 5 days post-fertilization (dpf) larvae derived from adult zebrafish exposed to either control or combined exposure conditions for 14 days. Gene expression data were normalized and expressed as stated in Fig. 2. All gene expression was further normalized to control larvae derived from control parents. Statistical differences between values were determined with two-way ANOVAs followed by post hoc Holm–Šidák tests (A: square-root transformed, parental exposure: P=0.001; larval exposure: P<0.001; parental exposure×larval exposure: P<0.001; B: log10-transformed; parental exposure: P=0.003; larval exposure: P<0.001; parental exposure×larval exposure: P=0.059). Differences within treatments across exposure at 5 dpf are indicated by different letters. Differences between treatments for a given exposure at 5 dpf are indicated by an asterisk. Data are means±s.e.m. (all n=6).

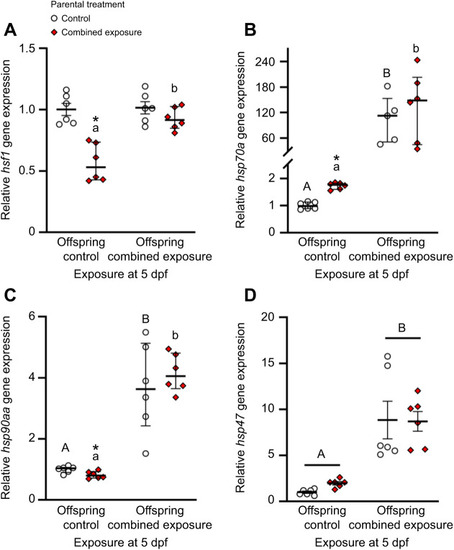
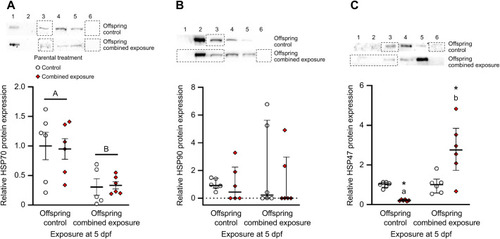
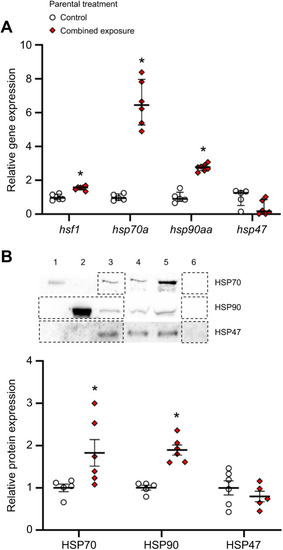
Effects of parental treatment on zebrafish embryo cellular stress response. (A) hsf1, hsp70a, hsp90aa and hsp47 relative gene expression and (B) representative western blot and HSP70, HSP90 and HSP47 relative protein expression in ∼1 h post-fertilization (hpf) embryos derived from adult zebrafish exposed to either control or combined exposure conditions for 14 days. Gene expression data were normalized and expressed as stated in Fig. 2. Statistical differences between gene values were determined by two-tailed t-tests (hsf1: P<0.001, hsp90aa: P<0.001, hsp47: P=0.054) or a Mann–Whitney rank sum test (hsp70a: P=0.004). Representative western blot analysis of HSP70 standard (lane 1), HSP90 standard (lane 2), pool of heat stressed gills (positive control; lane 3), control treatment (lane 4), combined exposure treatment (lane 5) and blank (lane 6). Each western blot run contained multiple samples from each treatment group, but for the sake of presentation clarity, only a single replicate for each treatment is presented, requiring spliced images (represented by dashed lines). Protein expression was normalized to Coomassie stain band intensity and expressed relative to the control treatment for each protein. All statistical differences between protein values were determined by two-tailed t-tests (HSP70: P=0.046; HSP90: P<0.001; HSP47: P=0.374). Differences between treatments for a given parameter are indicated by an asterisk. Data are medians and interquartile ranges in A and are means±s.e.m. in B (hsf1, hsp70a, hsp90aa and hsp47, n=5–7; HSP70, HSP90 and HSP47, n=5–6).

Effects of parental treatment on zebrafish larvae cellular stress gene expression. Control and post-exposure to combined elevated temperature and hypoxia relative gene expression for (A) hsf1, (B) hsp70a, (C) hsp90aa and (D) hsp47 in 5 days post-fertilization (dpf) larvae derived from adult zebrafish exposed to exposed to either control (offspring control) or combined exposure conditions (offspring combined exposure) for 14 days. Gene expression data were normalized and expressed as stated in Fig. 4. Statistical differences between values were determined by a two-way ANOVA followed by a Holm–Šidák post hoc test (D: square-root transformed, parental exposure: P=0.266; larval exposure: P<0.001; parental exposure×larval exposure: P=0.348), or two-tailed t-test (A: within control: P=0.830, within combined exposure: P<0.001) or Mann–Whitney rank sum tests (B: within control: P=0.004, within combined exposure: P=0.002; C: within control: P=0.002, within combined exposure: P=0.002) across exposure at 5 dpf, followed by two-tailed t-test (A: offspring combined exposure: P=0.174; B: offspring control: P<0.001, offspring combined exposure: P=0.484; C: offspring control: P=0.019, offspring combined exposure: P=0.477) or Mann–Whitney rank sum tests (A: offspring control: P=0.002) between parental treatments. Differences within treatments across exposure at 5 dpf are indicated by different letters. Differences between treatments for a given exposure at 5 dpf are indicated by an asterisk. Data are medians and interquartile ranges in A–C, and means±s.e.m. in D (all n=6; except hsp70a for combined exposure larvae from control parents, n=5).

Effects of parental treatment on zebrafish larvae cellular stress protein expression. Control and post-exposure to combined elevated temperature and hypoxia representative western blots and relative protein expression for (A) HSP70, (B) HSP90 and (C) HSP47 in 5 days post-fertilization (dpf) larvae derived from adult zebrafish exposed to either control (offspring control) or combined exposure conditions (offspring combined exposure) for 14 days. Western blot bands and protein expression was normalized and expressed as stated in Fig. 5. All protein expression was further normalized to control larvae derived from control parents. Statistical differences between values were determined by two-way ANOVA followed by a Holm–Šidák post hoc test (A: parental exposure: P=0.948; larval exposure: P<0.001; parental exposure×larval exposure: P=0.815), or two-tailed t-test (C: within control: P=0.941) or Mann–Whitney rank sum test (B: within control: P=0.394, within combined exposure: P=0.937; C: within combined exposure: P=0.002) across exposure at 5 dpf, followed by two-tailed t-tests (B: offspring control: P=0.987, C: offspring Control: P<0.001, offspring combined exposure: P=0.015) or Mann–Whitney rank sum tests (B: offspring combined exposure: P=0.394) between parental treatments. Differences within treatments across exposure at 5 dpf are indicated by different letters. Differences between treatments for a given exposure at 5 dpf are indicated by an asterisk. Data are means±s.e.m. in A, and medians and interquartile ranges in B and C (all n=6, except HSP70 for combined exposure larvae from control parents, n=5).

Effects of parental treatment on parental adult and larval offspring stress tolerance. (A) Critical thermal maxima (CTmax) and (B) hypoxic time to loss of equilibrium (LOE) of parental adult zebrafish exposed to either control or combined exposure conditions for 14 days, and (C) CTmax and (D) hypoxic time to LOE for 5 days post-fertilization (dpf) larvae derived from adult zebrafish exposed to either control or combined exposure conditions for 14 days. Tolerance values were compared with Mann–Whitney rank sum tests (A: P<0.001; D: P=0.235) or two-tailed t-tests (B: P=0.002; C: P=0.011). Differences between treatments for a given parameter are indicated by an asterisk. Data are medians and interquartile ranges in A and D and means±s.e.m. in B and C (all n=24, except larvae time to LOE, n=16).

Acknowledgments
This image is the copyrighted work of the attributed author or publisher, and ZFIN has permission only to display this image to its users. Additional permissions should be obtained from the applicable author or publisher of the image. Full text @ J. Exp. Biol.