
- Title
-
Intraocular Axon Regeneration in a Model of Penetrating Eye Injury
- Authors
- Hu, M., Veldman, M.B.
- Source
- Full text @ J. Ocul. Pharmacol. Ther.

Retina penetrating injury method and representative results. (A) Schematic of penetrating injury surgery procedure, and predicted injured site and regenerating RGCs with GFP expressed in gap43:GFP transgenic zebrafish. (B, C) Growth cones in regenerating RGCs marked by arrowheads. (D) Axonal varicosities (marked by arrowheads) in regenerating RGC axons. (E) Two-day postinjury retina flat-mount tiled image with magnified images of the injury site and the tip of regenerating RGC axons toward optic nerve head. Scale bars: (B, C) 10 μm; (D) 20 μm; (E) 200 μm. D, dorsal; GFP, green fluorescent protein; N, nasal; RGC, retinal ganglion cell; T, temporal; V, ventral. |
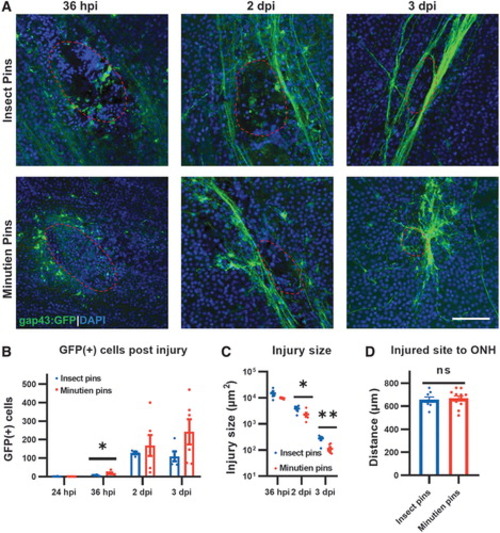
Changes in the injury site over time. (A) Representative retina flat-mount images at the site of injury (red circled). (B) Quantification of total GFP+ RGCs in the retina at different times postinjury. (C) Injury size recovery postretina penetrating injury. (D) Distance from retinal injury site to optic nerve head. All data are presented as mean ± SEM; each symbol represents 1 retina, ∼4 retinas from 3 animals were used in each experiment. *P < 0.05, **P < 0.01, by Student's t-test. Scale bar = 50 μm. ns, not significant; SEM, standard error of the mean. |
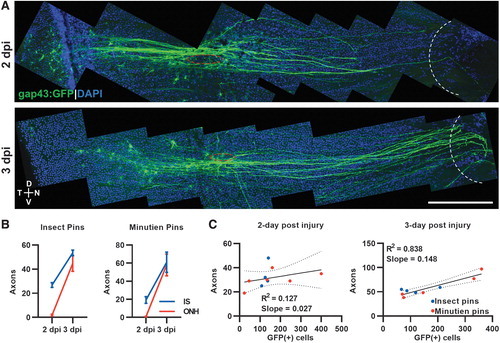
Regenerating axon quantification and correlation with GFP+ RGCs after retina penetrating injury. (A) Representative tiled retina flat mount image of GFP+ RGCs with regenerating axons (red circle, injury site; white curve, optic nerve head). (B) Axons at injury site and optic nerve head were counted at different time points with different surgery pins. (C) Correlation between total regenerating axons past the injury site and total GFP+ RGCs at 2- and 3-day postinjury. Data presented as mean ± SEM, ∼5 retinas from 3 animals were used in experiments. Scale bar = 200 μm. |
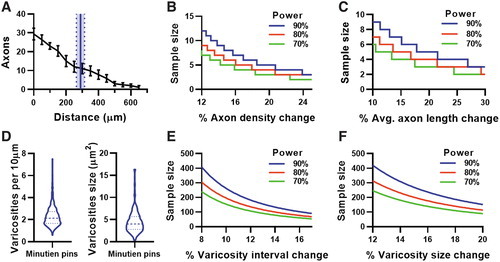
Intraocular axon regeneration assay properties at 2-day postinjury. (A) Axon count by growth cone distance from injury site (black lines) and averaging axon regenerate length from injured site using Minutien pins (blue line represents mean, dotted line with shaded area represents SEM of averaging axon length). (B) Power analysis of regenerating axon count from the injury site. (C) Power analysis of averaging axon length by using data from (A). (D) Varicosities interval and size at 2 dpi using Minutien pins, >200 measurements from 5 retinas were pooled for violin plot. (E) Power analysis of varicosities interval using pooled data from (D). (F) Power analysis of varicosities size using pooled data from (D). Data in (A) are present as mean ± SEM, 6 retinas from 3 animals were used in experiments. |

A single intraocular dose of colchicine delays axon regeneration and makes axonal varicosities smaller and more abundant. (A) Representative image of GFP+ regenerating RGC axons 2 days postinjury after intraocular vehicle injection at 1 day postinjury (red circle, injury site). (B) Representative image of GFP+ regenerating RGC axons at 2 days postinjury after intraocular colchicine injection on 1 day postinjury (red circle, injury site). (C) Axon counts by the distance to the injured site with different surgery pins. Gray boxes represent P < 0.05 for vehicle versus colchicine post hoc comparison. (D) Representative image of GFP+ regenerating RGC axons and axonal varicosities (partially marked by arrowheads) 2 days postinjury after intraocular vehicle injection at 1 day postinjury. (E) Representative image of GFP+ regenerating RGC axons and axonal varicosities (partially marked by arrowheads) 2 days postinjury after intraocular colchicine injection at 1 day postinjury. (F) Varicosity density on axons increases after colchicine treatment. (G) Varicosity size decreases after colchicine treatment. Data in (C) are presented as mean ± SEM, ∼5 retinas from 3 animals were used in experiments, 2-way ANOVA with Bonferroni post hoc were used. For (F, G), ∼200 varicosities from ∼3 animals were measured in each group for violin plot, Student's t-test was used, ***P < 0.001. Scale bar: (A, B), 200 μm; (D, E), 50 μm. ANOVA, analysis of variance. |
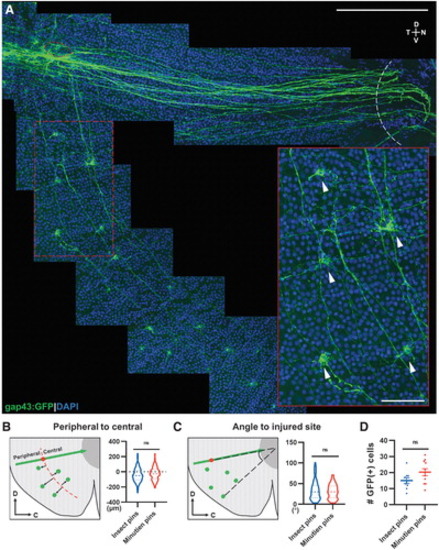
Ventral RGCs project axons circumferentially to the injury site. (A) Representative retina flat-mount image from a 3-day postinjury retina with magnification showing GFP+ RGCs (white arrowheads) from the ventral side of the injury projecting axons to the injury site (red circle: injured site, white curve: optic nerve head). (B) Schematic description and quantification of circumferential projecting GFP+ RGCs distribution relative to the injury site. (C) Schematic description and quantification of circumferential GFP+ RGCs relative angle to injury site. (D) Mean number of circumferential GFP+ cells activated postretina penetrating injury. In (B, C), 126 GFP+ cells from insect pins and 215 GFP+ cells from Minutien pins group were measured for violin plot. Data in (D) are presented as mean ± SEM. All data were acquired from ∼5 retinas, 3 animals. ns by Student's t-test. Scale bar = 200 and 50 μm. |