
Image
|
Figure Caption
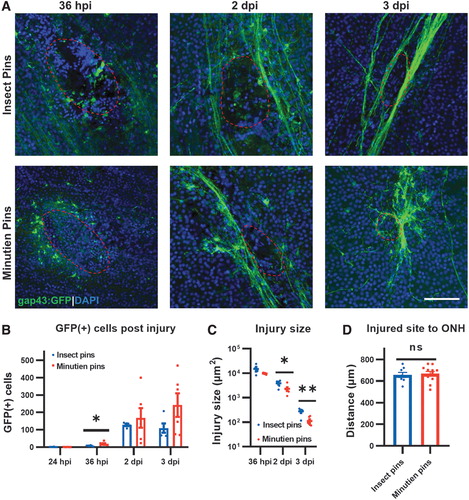
Fig. 2 Changes in the injury site over time. (A) Representative retina flat-mount images at the site of injury (red circled). (B) Quantification of total GFP+ RGCs in the retina at different times postinjury. (C) Injury size recovery postretina penetrating injury. (D) Distance from retinal injury site to optic nerve head. All data are presented as mean ± SEM; each symbol represents 1 retina, ∼4 retinas from 3 animals were used in each experiment. *P < 0.05, **P < 0.01, by Student's t-test. Scale bar = 50 μm. ns, not significant; SEM, standard error of the mean.
Acknowledgments
This image is the copyrighted work of the attributed author or publisher, and
ZFIN has permission only to display this image to its users.
Additional permissions should be obtained from the applicable author or publisher of the image.
Full text @ J. Ocul. Pharmacol. Ther.