
|
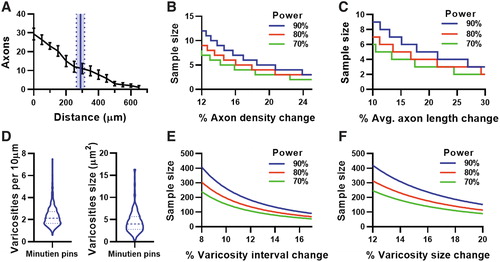
Fig. 4 Intraocular axon regeneration assay properties at 2-day postinjury. (A) Axon count by growth cone distance from injury site (black lines) and averaging axon regenerate length from injured site using Minutien pins (blue line represents mean, dotted line with shaded area represents SEM of averaging axon length). (B) Power analysis of regenerating axon count from the injury site. (C) Power analysis of averaging axon length by using data from (A). (D) Varicosities interval and size at 2 dpi using Minutien pins, >200 measurements from 5 retinas were pooled for violin plot. (E) Power analysis of varicosities interval using pooled data from (D). (F) Power analysis of varicosities size using pooled data from (D). Data in (A) are present as mean ± SEM, 6 retinas from 3 animals were used in experiments.