
Image
|
Figure Caption
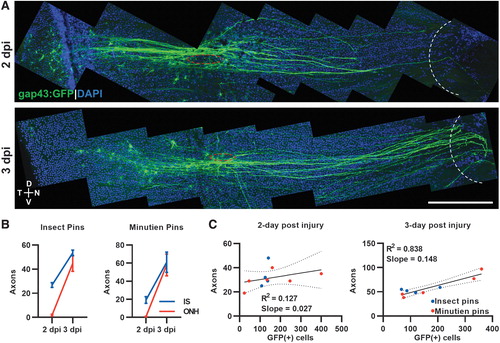
Fig. 3 Regenerating axon quantification and correlation with GFP+ RGCs after retina penetrating injury. (A) Representative tiled retina flat mount image of GFP+ RGCs with regenerating axons (red circle, injury site; white curve, optic nerve head). (B) Axons at injury site and optic nerve head were counted at different time points with different surgery pins. (C) Correlation between total regenerating axons past the injury site and total GFP+ RGCs at 2- and 3-day postinjury. Data presented as mean ± SEM, ∼5 retinas from 3 animals were used in experiments. Scale bar = 200 μm.
Acknowledgments
This image is the copyrighted work of the attributed author or publisher, and
ZFIN has permission only to display this image to its users.
Additional permissions should be obtained from the applicable author or publisher of the image.
Full text @ J. Ocul. Pharmacol. Ther.