FIGURE SUMMARY
Title

Inversely Regulated Inflammation-Related Processes Mediate Anxiety-Obesity Links in Zebrafish Larvae and Adults

Authors
Yehuda, H., Madrer, N., Goldberg, D., Soreq, H., Meerson, A.
Source
Full text @ Cells

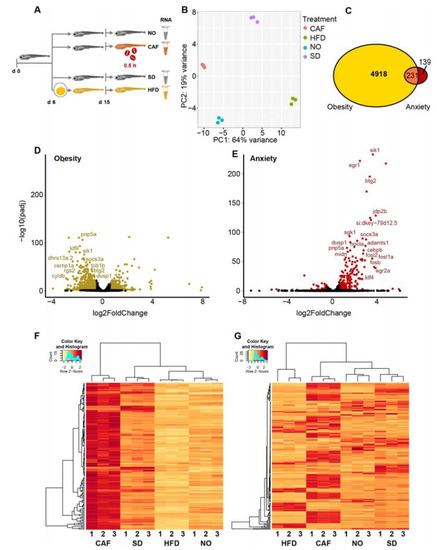
Most anxiety-upregulated larvae transcripts were downregulated in obesity. (A) Experimental design: zebrafish larvae (6 days post-fertilization (dpf)) were fed either a standard diet (SD) or high-fat diet (HFD, based on hard-boiled egg yolk solution). At age 15 dpf, a group of the SD-fed larvae were further divided into caffeine-exposed larvae (CAF) and the controls (non-treated (NO)). Following caffeine exposure (0.5 h) of the CAF larvae, larvae of all treatments were snap-frozen until RNA extraction for RNA-seq. (B) Profiles based on 32,520 Poly(A)+ mapped transcripts clustered according to principal component analysis (PCA) treatment. (C) A total of 231 poly(A)+ transcripts were differentially expressed (DE) (padj < 0.05) in both the obesity (yellow) and anxiety (red) models. (D) Obesity model volcano plot—DE, transcripts color-marked gold; padj < 0.05 and absolute log2 fold change > 0.58 (>1.5 and <0.67-fold change)). Labeled transcripts are among the 107 genes upregulated > 1.5 fold in the anxiety model and downregulated < 0.67 fold in the obesity model. (E) Anxiety model volcano plot—DE, transcripts color-marked red; padj < 0.05 and absolute log2 fold change > 0.58 (>1.5 and <0.67-fold change)). Labeled transcripts are among the 107 genes upregulated > 1.5 fold in the anxiety model and downregulated < 0.67 fold in the obesity model. (F) Heatmap of transcripts per million (TPM) from RSEM of 142 DE poly(A)+ transcripts upregulated in anxiety model (>1.5 fold, padj < 0.05). (G) Heatmap of 182 DE isoform transcripts (FDR < 0.05) that were upregulated > 1.5-fold in the anxiety model and downregulated < 0.67-fold in the obesity model. A total of thirty larvae per replicate, three replicates per treatment.

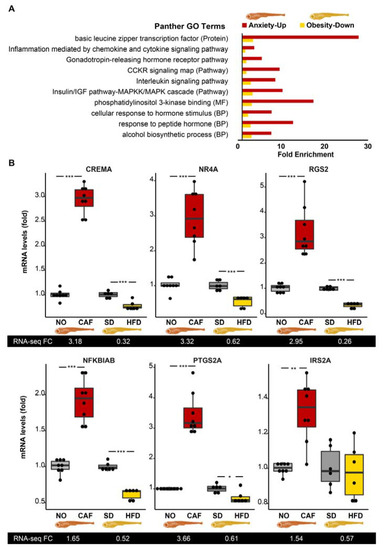
Larval inflammation/immune pathways are upregulated in anxiety and downregulated in obesity. (A) PANTHER Overrepresentation Test identified “CCKR—gastrin- and cholecystokinin-mediated regulation of cellular processes signaling map”, “inflammation mediated by chemokine and cytokine signaling pathway”, and “interleukin signaling pathway”. Reference genes were all those included in the Danio rerio database, Fisher’s exact test, correction by FDR < 0.05. (B) Quantitative reverse transcription polymerase chain reaction (qRT-PCR) results of the anxiety and obesity models are presented as graphs, with RNA-seq results below each graph, n= 6–8 replicates (10–30 larvae/replicate), 2–3 separate experiments, Student’s t-test. Reference genes are the average of eef1a1l1 and actb2. *—p < 0.05, **—p < 0.01, ***—p < 0.001.

Most differentially expressed (DE) long intergenic noncoding RNAs (lincRNAs) were upregulated in the anxiety model and downregulated in the obesity model, similar to protein-coding genes. (A) Long noncoding RNAs (lncRNAs), classified as long intergenic noncoding RNAs (lincRNA) (purple), processed transcripts (dark grey), and retained introns (light grey) with fold change > 1.5 or <0.66, FDR < 0.05. Arrows pointing upward: upregulation, arrows pointing downward: downregulation. Yellow: obesity model; red: anxiety model. (B) qRT-PCR of lincRNA. N = 5–8 replicates (10–30 larvae/replicate), 2–3 separate experiments. Reference genes: average of eef1a1l1 and actb2. *—p < 0.05, **—p < 0.01, ***—p < 0.001. Student’s t-test.

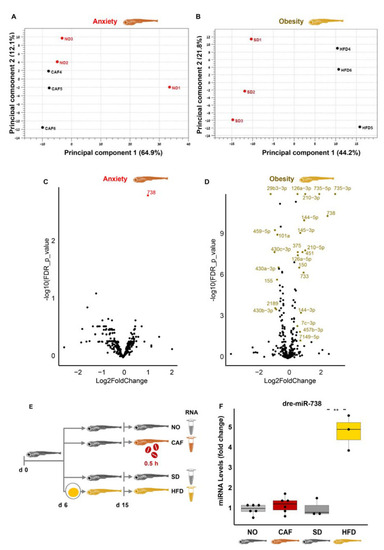
Null involvement of microRNAs (miRNAs) in the anxiety and obesity link in zebrafish larvae. (A,B) PCA graphs of anxiety and obesity, respectively. (C) Volcano plot of anxiety model. Red points: DE in the anxiety model, FDR < 0.05, and absolute log2 fold change > 0.58 (>1.5 and <0.67 fold change). The “dre-miR” prefix has been removed from miRNA labels to enable better visualization. (D) Volcano plot of obesity model. Gold points: DE in the obesity model, FDR < 0.05, and absolute log2 fold change > 0.58 (>1.5 and <0.67 fold change). (E) Experimental design: zebrafish larvae (6 days post-fertilization (dpf)) were fed either the standard diet (SD) or high-fat diet (HFD). At age 15 dpf, a group of the standard diet-fed larvae were further divided into caffeine-exposed larvae (CAF) and the controls (NO). Following caffeine exposure (0.5 h) of the CAF larvae, larvae of all treatments were snap-frozen until RNA extraction for RNA-seq. (F) qRT-PCR of dre-miR-738 in the anxiety and obesity models, Student’s t-test, n = 3–8 (10–30 larvae/replicate, and 1–3 independent experiments, where RNA of one of the experiments had been used in RNA-seq. The reference was the average of three miRNAs: dre-miR-let7a, dre-miR-125b-5p, and dre-miR-26a-5p. **—p < 0.01.

Transfer RNA fragments (tRFs), as well, are inversely regulated in anxiety and obesity. (A) HFD vs. SD. (B) CAF vs. NO. The encircled dots are the 13 tRFs that are upregulated in anxiety and downregulated in obesity.

Obese larvae failed to present anxiety-like behavior and vice versa. (A) The timeline and results demonstrating the effect of anxiety (caffeine pretreatments (100 mg/L for 0.5 h)) on obesity (adipocyte size and number in the abdominal area of the larvae), n = 15–21. (B) The parallel effect of obesity (egg yolk solution-based HFD, 10 days) on anxiety-like behavior (thigmotaxis and erratic swimming), n = 6. Note the absence of apparent links between the two impacts.

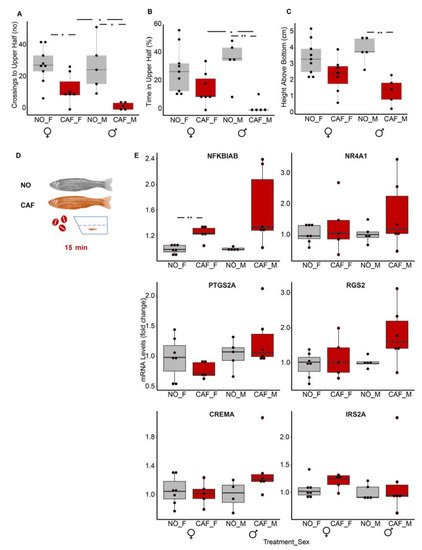
The nuclear factor kappa-light-chain-enhancer of activated B cells (NFκB) inhibitor (nfkbiab) transcript was upregulated in whole bodies of anxiety-induced middle-aged adult males and females. Anxiety-like behavioral tests: (A) crossings to upper half of tank, (B) percent of the time in the upper half of tank (C) height above the bottom of the tank. NO F, CAF F—non-treated and caffeine-exposed females; NO M, CAF M—non-treated and caffeine-exposed males. n = 5 male and n= 7–9 female fish in three independent experiments (each experiment had both males and females). Student’s t-test, *—p < 0.05, **—p < 0.01. (D) Scheme showing that individual fish were exposed to water or water containing caffeine in the tank for 15 min, during which movements were recorded. NO—no treatment; CAF—caffeine exposure. (E) qRT-PCR results: n= 4–6 male fish and 5–7 females in each treatment; two independent experiments, with males and females in each. The reference genes were actb2 and eef1a1l1. Student’s t-test.

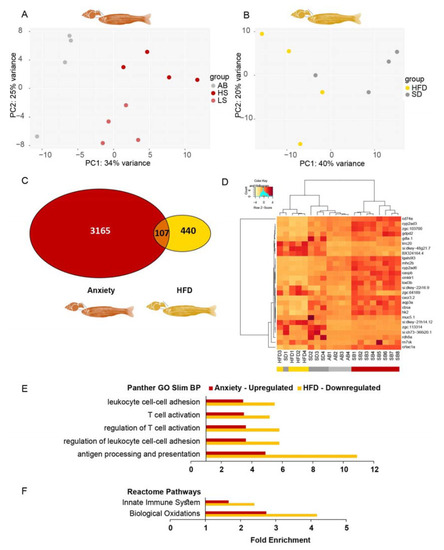
Immune system-related gene ontology (GO) terms are enriched among transcripts increased in anxiety and decreased under high-fat diet (HFD) conditions in adult zebrafish. (A) PCA of transcripts from young adult zebrafish brains: AB—low anxiety; SB (HS and LS)—high anxiety. (B) PCA of transcripts from telencephalons of young adult zebrafish fed HFD or SD. (C) A total of 107 transcripts were commonly differentially expressed (DE) (padj < 0.05) in anxiety (red) and HFD (yellow) in adult zebrafish. (D) Heatmap of the 27 transcripts upregulated (>1.5) in anxiety among the DE (padj < 0.05) intersecting genes in zebrafish adults; AB—low anxiety, SB—high anxiety. (E) Overrepresented Panther GO-slim biological processes (BP) common in upregulated anxiety and downregulated HFD genes in zebrafish adults. (F) Overrepresented Reactome Pathways common to upregulated anxiety and downregulated HFD genes in zebrafish adults. Reference transcripts were all found in the Danio rerio database, Fisher’s exact test, and correction by FDR < 0.05.

Acknowledgments
This image is the copyrighted work of the attributed author or publisher, and ZFIN has permission only to display this image to its users. Additional permissions should be obtained from the applicable author or publisher of the image. Full text @ Cells