IMAGE

Figure 4

ID
ZDB-IMAGE-230717-13
Source
Figures for Yehuda et al., 2023
Image
Figure Caption

Figure 4

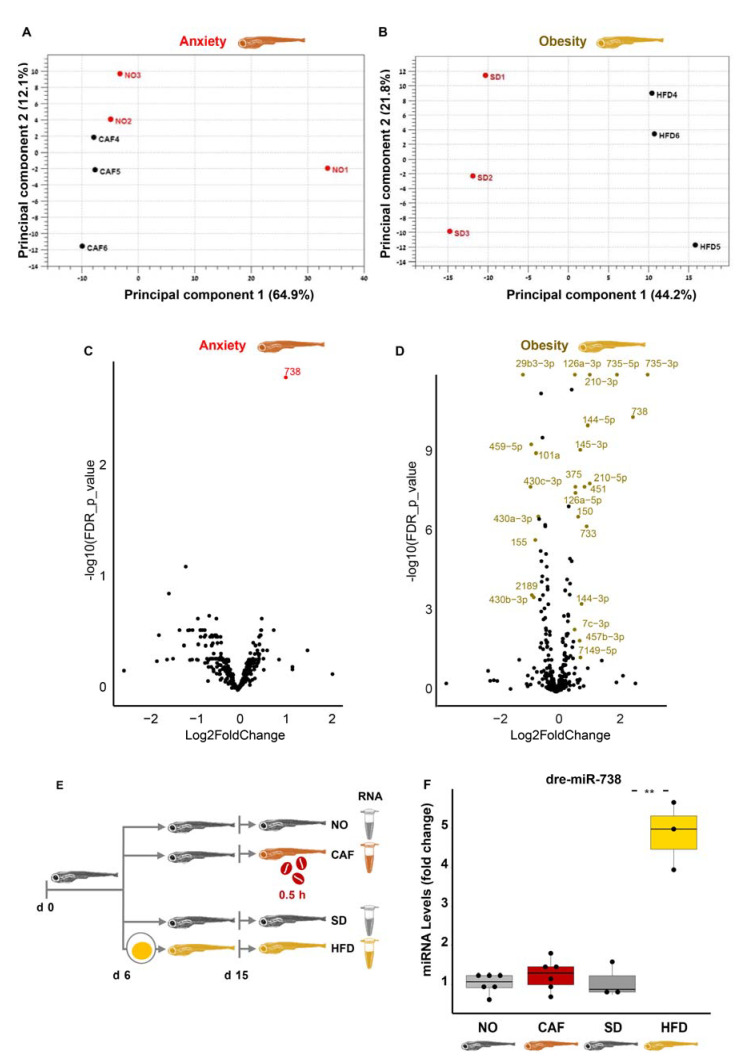
Null involvement of microRNAs (miRNAs) in the anxiety and obesity link in zebrafish larvae. (A,B) PCA graphs of anxiety and obesity, respectively. (C) Volcano plot of anxiety model. Red points: DE in the anxiety model, FDR < 0.05, and absolute log2 fold change > 0.58 (>1.5 and <0.67 fold change). The “dre-miR” prefix has been removed from miRNA labels to enable better visualization. (D) Volcano plot of obesity model. Gold points: DE in the obesity model, FDR < 0.05, and absolute log2 fold change > 0.58 (>1.5 and <0.67 fold change). (E) Experimental design: zebrafish larvae (6 days post-fertilization (dpf)) were fed either the standard diet (SD) or high-fat diet (HFD). At age 15 dpf, a group of the standard diet-fed larvae were further divided into caffeine-exposed larvae (CAF) and the controls (NO). Following caffeine exposure (0.5 h) of the CAF larvae, larvae of all treatments were snap-frozen until RNA extraction for RNA-seq. (F) qRT-PCR of dre-miR-738 in the anxiety and obesity models, Student’s t-test, n = 3–8 (10–30 larvae/replicate, and 1–3 independent experiments, where RNA of one of the experiments had been used in RNA-seq. The reference was the average of three miRNAs: dre-miR-let7a, dre-miR-125b-5p, and dre-miR-26a-5p. **—p < 0.01.

Acknowledgments
This image is the copyrighted work of the attributed author or publisher, and ZFIN has permission only to display this image to its users. Additional permissions should be obtained from the applicable author or publisher of the image. Full text @ Cells