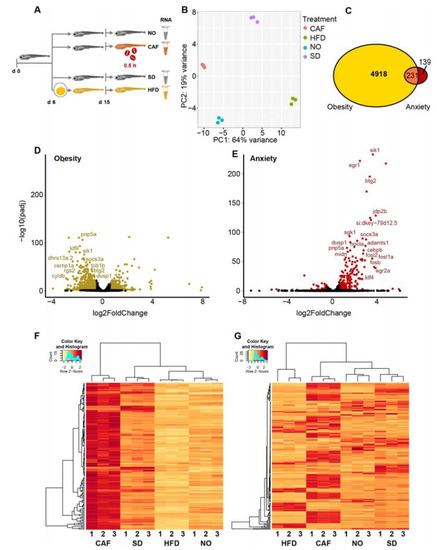
Most anxiety-upregulated larvae transcripts were downregulated in obesity. (A) Experimental design: zebrafish larvae (6 days post-fertilization (dpf)) were fed either a standard diet (SD) or high-fat diet (HFD, based on hard-boiled egg yolk solution). At age 15 dpf, a group of the SD-fed larvae were further divided into caffeine-exposed larvae (CAF) and the controls (non-treated (NO)). Following caffeine exposure (0.5 h) of the CAF larvae, larvae of all treatments were snap-frozen until RNA extraction for RNA-seq. (B) Profiles based on 32,520 Poly(A)+ mapped transcripts clustered according to principal component analysis (PCA) treatment. (C) A total of 231 poly(A)+ transcripts were differentially expressed (DE) (padj < 0.05) in both the obesity (yellow) and anxiety (red) models. (D) Obesity model volcano plot—DE, transcripts color-marked gold; padj < 0.05 and absolute log2 fold change > 0.58 (>1.5 and <0.67-fold change)). Labeled transcripts are among the 107 genes upregulated > 1.5 fold in the anxiety model and downregulated < 0.67 fold in the obesity model. (E) Anxiety model volcano plot—DE, transcripts color-marked red; padj < 0.05 and absolute log2 fold change > 0.58 (>1.5 and <0.67-fold change)). Labeled transcripts are among the 107 genes upregulated > 1.5 fold in the anxiety model and downregulated < 0.67 fold in the obesity model. (F) Heatmap of transcripts per million (TPM) from RSEM of 142 DE poly(A)+ transcripts upregulated in anxiety model (>1.5 fold, padj < 0.05). (G) Heatmap of 182 DE isoform transcripts (FDR < 0.05) that were upregulated > 1.5-fold in the anxiety model and downregulated < 0.67-fold in the obesity model. A total of thirty larvae per replicate, three replicates per treatment.
|
