
- Title
-
Erigeron annuus Extract Alleviates Insulin Resistance via Regulating the Expression of Mitochondrial Damage and Endoplasmic Reticulum Stress-Related Genes
- Authors
- Lee, H.K., Nam, Y.H., Shin, S.W., Kim, M.C., An, J.I., Kim, N.W., Shim, J.H., Srinath, S., Hong, B.N., Kwak, J.H., Kang, T.H.
- Source
- Full text @ Nutrients

High-performance liquid chromatography (HPLC) analysis for EAE. (A) HPLC-UV chromatogram of EAE. (B) HPLC-UV chromatogram of chlorogenic acid as a standard compound. The major component in the extract was identified and quantified by using HPLC analysis. HPLC analysis was carried out via gradient elution on a Phenomenex Kinetex C18 column (150 × 4.6 mm, 5 µm). The flow rate, column oven temperature, and UV wavelength for detection were set at 1 mL/min, 30 °C, and 325 nm, respectively. (C) Chemical structure of chlorogenic acid, and regression equation and correlation coefficient for the standard compound. |
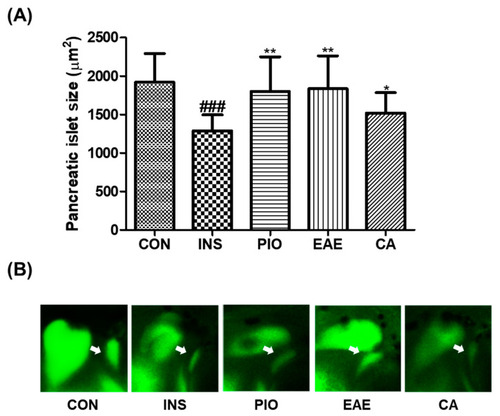
Effect of EAE and CA on insulin-treated pancreatic islet-damaged zebrafish. (A) Pancreatic islet size of each group. (B) Fluorescent images of pancreatic islet. (###p < 0.001; compared to control), (* p < 0.05, ** p < 0.01; compared to INS). White arrows indicate the pancreatic islets. Control group (CON); insulin-treated group (INS); pioglitazone-treated group (PIO); EAE-treated group (EAE); chlorogenic acid-treated group (CA). |

Concentration–effect curves of EAE. The EC50 of EAE was 0.54 μg/mL. The values are expressed as percentages of the baseline and each point was assessed in 0.01–10 μg/mL concentration range for determination of EC50. |

LC50 of zebrafish embryos exposed to EAE for 72 h. The LC50 of EAE was 202.5 μg/mL. The values are expressed as percentages of the baseline and each point was assessed in 10–500 μg/mL concentration range for determination of LC50. |

The therapeutic index (TI) of EAE. The TI of EAE was 374. Two non-linear curves for determining the EC50 and LC50 were expressed as blue and red line, respectively. |
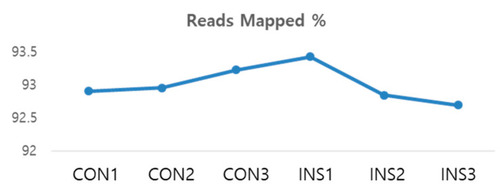
Average mapping rate. |

Differentially expressed genes (DEGs) by EAE in insulin-treated zebrafish. (A) Volcano plot of control + EAE vs. insulin resistance + EAE group. Of the total genes, 107 were significantly altered by insulin resistance + EAE (FDR < 0.05, |FC| > 1.0). (B) Heat map based on RNA-seq analysis of gene expression in EAE-treated zebrafish. |

KEGG pathway analysis of the differentially expressed genes (DEGs) involved in oxidative phosphorylation. Green boxes indicate the DEGs by EAE treatment in the control group, and the red boxes show the DEGs by EAE treatment in the insulin-treated group. The DEGs highlighted by red rectangular mark in the figure represent significantly downregulated genes in EAE treatment in insulin-treated zebrafish. |

KEGG pathway analysis of the DEGs involved in protein processing in the endoplasmic reticulum. Green boxes indicate the DEGs by EAE treatment in the control group, and the red boxes show the DEGs by EAE treatment in the insulin-treated group. The DEGs highlighted by red rectangular mark in the figure represent significantly downregulated genes in EAE treatment in insulin-treated zebrafish. |

HSP70 genes. Data are presented as means ± SD. (A) The COX4I1 gene was determined by RT-PCR. (#) p < 0.05; compared to normal group (NOR). (**) p < 0.01; compared to insulin-treated group (INS). (B) The HSP70 gene was determined by RT-PCR. (###) p < 0.001; compared to normal group (NOR). (*) p < 0.05; compared to insulin-treated group (INS). |