
Image
|
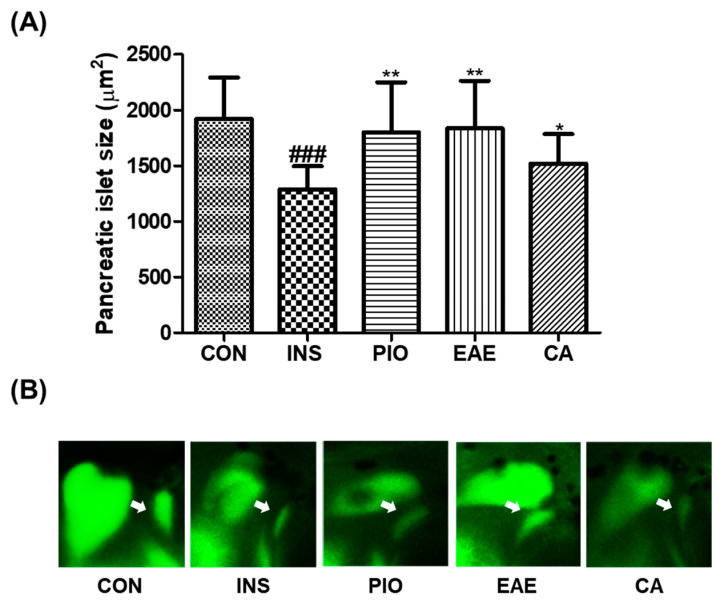
Figure Caption
Figure 2
Effect of EAE and CA on insulin-treated pancreatic islet-damaged zebrafish. (A) Pancreatic islet size of each group. (B) Fluorescent images of pancreatic islet. (###p < 0.001; compared to control), (* p < 0.05, ** p < 0.01; compared to INS). White arrows indicate the pancreatic islets. Control group (CON); insulin-treated group (INS); pioglitazone-treated group (PIO); EAE-treated group (EAE); chlorogenic acid-treated group (CA).
Acknowledgments
This image is the copyrighted work of the attributed author or publisher, and
ZFIN has permission only to display this image to its users.
Additional permissions should be obtained from the applicable author or publisher of the image.
Full text @ Nutrients