
Image
|
Figure Caption
Figure 5
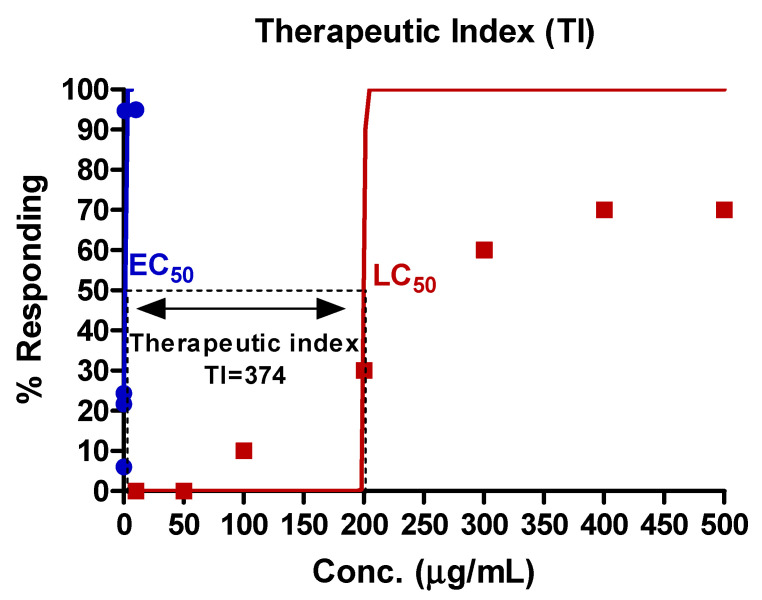
The therapeutic index (TI) of EAE. The TI of EAE was 374. Two non-linear curves for determining the EC50 and LC50 were expressed as blue and red line, respectively.
Acknowledgments
This image is the copyrighted work of the attributed author or publisher, and
ZFIN has permission only to display this image to its users.
Additional permissions should be obtained from the applicable author or publisher of the image.
Full text @ Nutrients