
Image
|
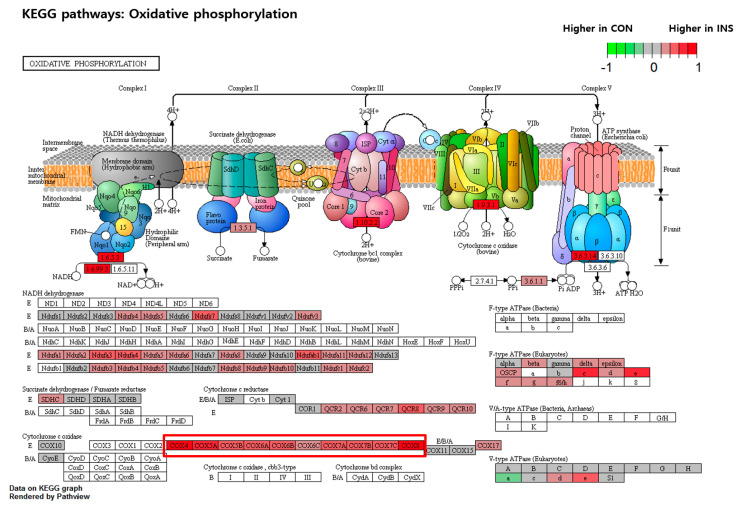
Figure Caption
Figure 8
KEGG pathway analysis of the differentially expressed genes (DEGs) involved in oxidative phosphorylation. Green boxes indicate the DEGs by EAE treatment in the control group, and the red boxes show the DEGs by EAE treatment in the insulin-treated group. The DEGs highlighted by red rectangular mark in the figure represent significantly downregulated genes in EAE treatment in insulin-treated zebrafish.
Acknowledgments
This image is the copyrighted work of the attributed author or publisher, and
ZFIN has permission only to display this image to its users.
Additional permissions should be obtained from the applicable author or publisher of the image.
Full text @ Nutrients