
Image
|
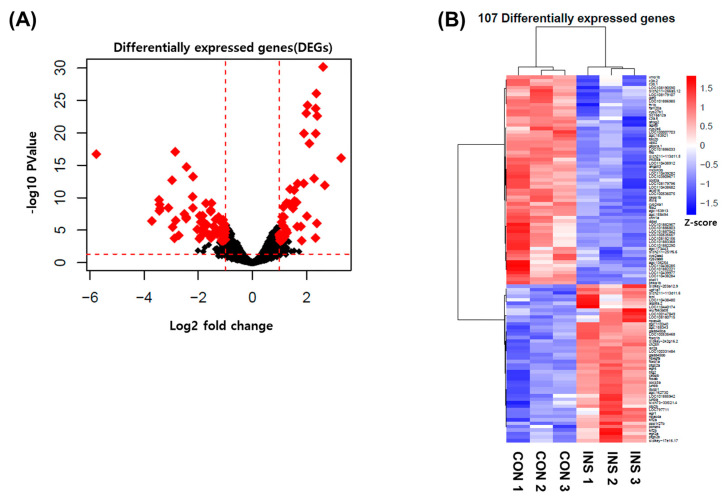
Figure Caption
Figure 7
Differentially expressed genes (DEGs) by EAE in insulin-treated zebrafish. (A) Volcano plot of control + EAE vs. insulin resistance + EAE group. Of the total genes, 107 were significantly altered by insulin resistance + EAE (FDR < 0.05, |FC| > 1.0). (B) Heat map based on RNA-seq analysis of gene expression in EAE-treated zebrafish.
Acknowledgments
This image is the copyrighted work of the attributed author or publisher, and
ZFIN has permission only to display this image to its users.
Additional permissions should be obtained from the applicable author or publisher of the image.
Full text @ Nutrients