
Image
|
Figure Caption
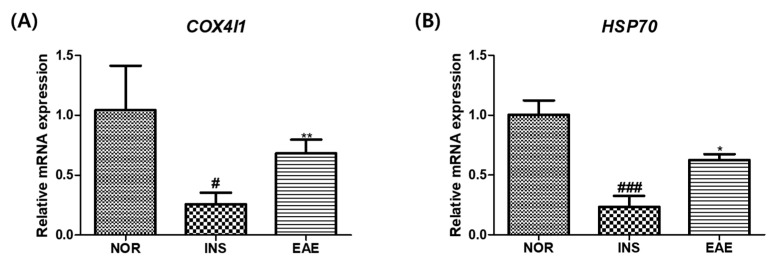
Figure 10 HSP70 genes. Data are presented as means ± SD. (A) The COX4I1 gene was determined by RT-PCR. (#) p < 0.05; compared to normal group (NOR). (**) p < 0.01; compared to insulin-treated group (INS). (B) The HSP70 gene was determined by RT-PCR. (###) p < 0.001; compared to normal group (NOR). (*) p < 0.05; compared to insulin-treated group (INS).
Acknowledgments
This image is the copyrighted work of the attributed author or publisher, and
ZFIN has permission only to display this image to its users.
Additional permissions should be obtained from the applicable author or publisher of the image.
Full text @ Nutrients