
- Title
-
Upf3a but not Upf1 mediates the genetic compensation response induced by leg1 deleterious mutations in an H3K4me3-independent manner
- Authors
- Xie, A., Ma, Z., Wang, J., Zhang, Y., Chen, Y., Yang, C., Chen, J., Peng, J.
- Source
- Full text @ Cell Discov
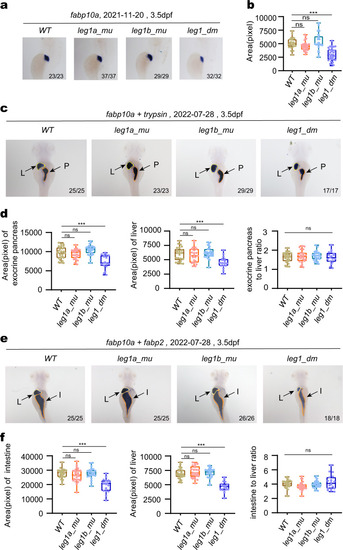
a, b Representative WISH images using the fabp10a probe (liver marker) at 3.5 dpf (a) and statistical analysis of the liver size (b). leg1azju3/zju3leg1bzju1/zju1 double homozygous mutants (leg1_dm) exhibited a small liver phenotype when compared with WT, leg1azju1/zju1 (leg1a_mu) single and leg1bzju1/zju1 (leg1b_mu) single homozygous mutants. |
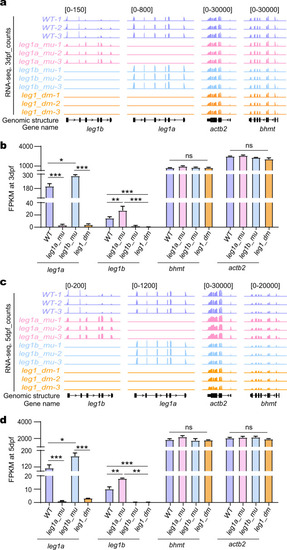
a–d Genome browser view (a, c) and statistical analysis (b, d) of leg1a and leg1b transcript counts (FPKM) together with actb2 and bhmt two control genes in RNA-seq samples obtained from WT, leg1a_mu single, leg1b_mu single and leg1_dm double mutant embryos at 3 dpf (a, b) and at 5 dpf (c, d), respectively. ns, no significance; *P < 0.05; **P < 0.01; ***P < 0.001. |
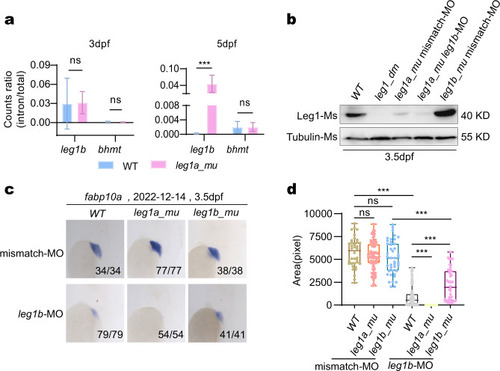
a Statistical analysis of the ratios of the precursor and total leg1b transcripts in WT and leg1azju1/zju1 at 3 dpf and 5 dpf, respectively. Nine RNA-seq datasets each for WT and leg1azju1/zju1 at 3 dpf and 5 dpf were used for this analysis (refer to Supplementary Tables S1, S2, S7, S8, S13, S14). b Western blot of Leg1 from embryos at 3.5 dpf after injection of leg1b-MO in different genotypes as shown. Tubulin, loading control. c, d Representative images showing the WISH result using the fabp10a probe (c) and statistical analysis of the liver size (d) in different genotypes injected with leg1b-MO or control mismatch morpholino (mismatch-MO) as indicated. c Top: the date of experiments performed; bottom right: number of embryos showing the phenotype over total embryos examined. d The y axis shows the positive signal area in each embryo stained with the fabp10a probe. |
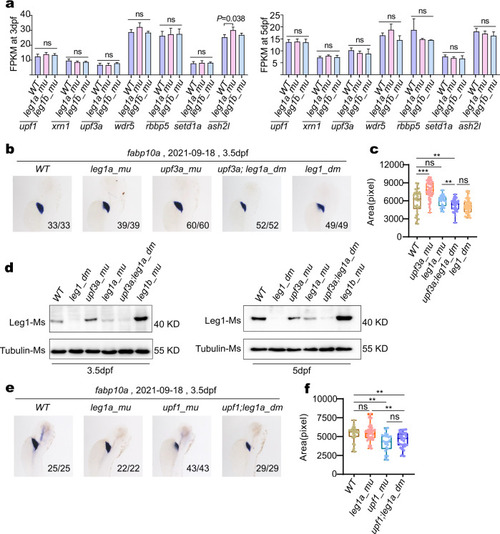
a Statistical analysis of transcript counts (FPKM) of the genes encoding components of the NMD pathway and COMPAS complex in RNA-seq samples obtained from WT, leg1a_mu single and leg1b_mu single mutant embryos at 3 dpf and at 5 dpf, respectively. b, c Representative images showing the WISH result using the fabp10a probe (b) and the statistical analysis of liver sizes (c) in the WT, leg1a_mu, upf3a_mu, upf3a;leg1a_dm and leg1_dm embryos at 3.5 dpf. d Western blot of Leg1 protein in different genotypes at 3.5 dpf and 5 dpf, respectively. Tubulin, loading control. e, f Representative images showing the WISH result using the fabp10a probe (e) and the statistical analysis of liver sizes (f) in the WT, leg1a_mu, upf1_mu, and upf1;leg1a_dm embryos at 3.5dpf. b, e Top: the date of experiments performed; bottom right: number of embryos showing the phenotype over total embryos examined. ns, no significance; **P < 0.01; ***P < 0.001. |
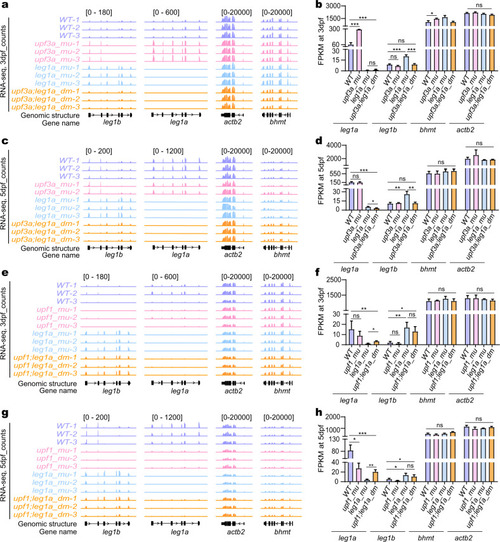
a–d Showing genome browser view (a, c) and statistical analysis (b, d) of leg1a and leg1b transcript counts (FPKM) together with actb2 and bhmt two control genes in RNA-seq samples obtained from WT, upf3a−/− (upf3a_mu) single, leg1azju1/zju1 (leg1a_mu) single and upf3a−/−leg1azju1/zju1 (upf3a;leg1a_dm) double mutant embryos at 3 dpf (a, b) and at 5 dpf (c, d), respectively. e–h Genome browser view (e, g) and statistical analysis (f, h) of leg1a and leg1b transcript counts (FPKM) together with actb2 and bhmt two control genes in RNA-seq samples obtained from WT, upf1−/− (upf1_mu) single, leg1azju1/zju1 (leg1a_mu) single and upf1−/−leg1azju1/zju1 (upf1;leg1a_dm) double mutant embryos at 3 dpf (e, f) and at 5 dpf (g, h), respectively. ns, no significance; *P < 0.05; **P < 0.01; ***P < 0.001. |
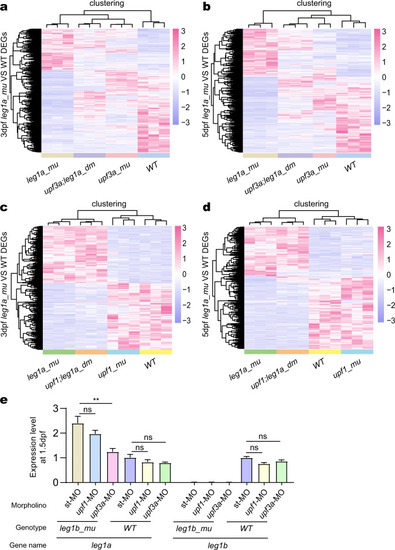
a, b DEGs between WT and leg1azju1/zju1 (leg1a_mu) at 3 dpf (a) and 5 dpf (b) were identified by analyzing the RNA-seq data, respectively. The heat-map shows the hierarchical clustering of these DEGs in the RNA-seq samples obtained from upf3a−/− (upf3a_mu) single and upf3a−/−leg1azju1/zju1 (upf3a;leg1a_dm) double mutant embryos at 3 dpf (a) and 5 dpf (b), respectively. c, d DEGs between WT and leg1azju1/zju1 (leg1a_mu) at 3 dpf (a) and 5dpf (b) were identified by analyzing the RNA-seq data, respectively. The heat-map shows the hierarchical clustering of these DEGs in the RNA-seq samples obtained from upf1−/− (upf1_mu) single and upf1−/−leg1azju1/zju1 (upf1;leg1a_dm) double mutant embryos at 3 dpf (c) and 5 dpf (d), respectively. e The qPCR analysis of leg1a and leg1b transcripts in WT and leg1bzju1/zju1 at 1.5 dpf. The embryos were injected with st-MO, upf1-MO, or upf3a-MO at the one-cell stage. |
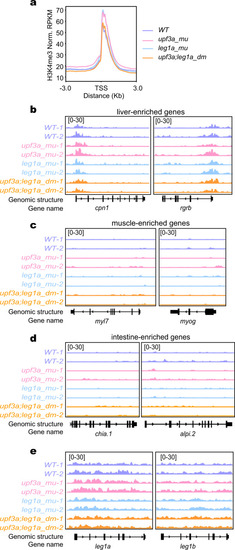
a Graph showing the normalized reads distribution profiles of the genome-wide H3K4me3 enrichment (RPKM) in the liver dissected from WT, leg1a_mu, upf3a_mu and upf3a;leg1a_dm embryos at 5 dpf. TSS, transcription start site. b–e Genome browser view of the H3K4me3 enrichment in the genomic region of representative liver-specific (b), muscle-enriched (c), intestine-enriched genes (d) and leg1a and leg1b (e) genes. The y axis shows the ULI-NChIP counts across the genomic region shown. |
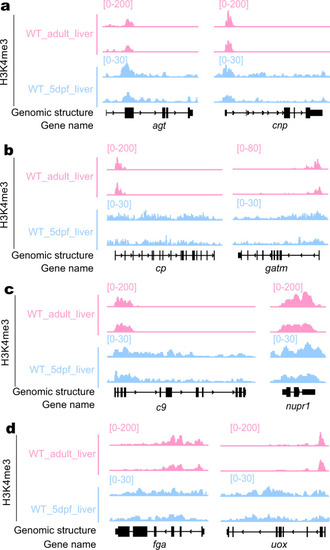
a–d Genome browser view of the genomic region of representative genes in the category of TSS specific-enrichment of H3K4me3 in both adult and embryonic liver (a), TSS-specific enrichment of H3K4me3 in the adult liver but not the embryonic liver (b), H3K4me3 enrichment in the TTS together with gene body region in both adult and embryonic liver (c) and different patterns of H3K4me3 enrichment in the TSS together with gene body region between adult and embryonic liver (d). The y axis shows the ChIP-seq counts across the genomic region shown. The adult liver ChIP-seq data were extracted from the database (SRA: SRX6422954 and SRX6422955) and the embryonic liver data were obtained in this work. |