
|
Fig. 6
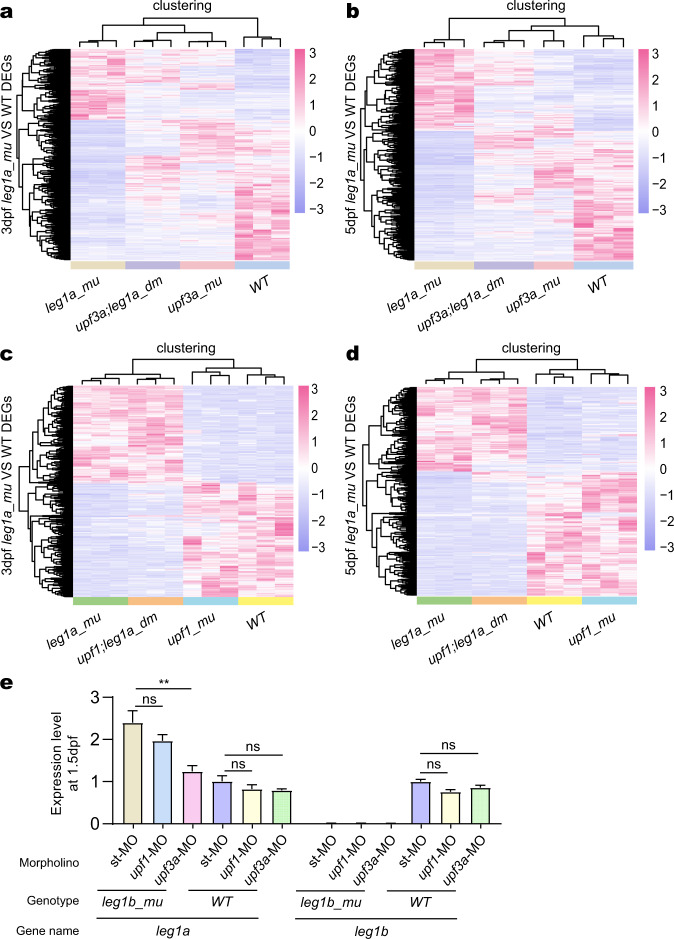
a, b DEGs between WT and leg1azju1/zju1 (leg1a_mu) at 3 dpf (a) and 5 dpf (b) were identified by analyzing the RNA-seq data, respectively. The heat-map shows the hierarchical clustering of these DEGs in the RNA-seq samples obtained from upf3a−/− (upf3a_mu) single and upf3a−/−leg1azju1/zju1 (upf3a;leg1a_dm) double mutant embryos at 3 dpf (a) and 5 dpf (b), respectively. c, d DEGs between WT and leg1azju1/zju1 (leg1a_mu) at 3 dpf (a) and 5dpf (b) were identified by analyzing the RNA-seq data, respectively. The heat-map shows the hierarchical clustering of these DEGs in the RNA-seq samples obtained from upf1−/− (upf1_mu) single and upf1−/−leg1azju1/zju1 (upf1;leg1a_dm) double mutant embryos at 3 dpf (c) and 5 dpf (d), respectively. e The qPCR analysis of leg1a and leg1b transcripts in WT and leg1bzju1/zju1 at 1.5 dpf. The embryos were injected with st-MO, upf1-MO, or upf3a-MO at the one-cell stage.