
Image
|
Figure Caption
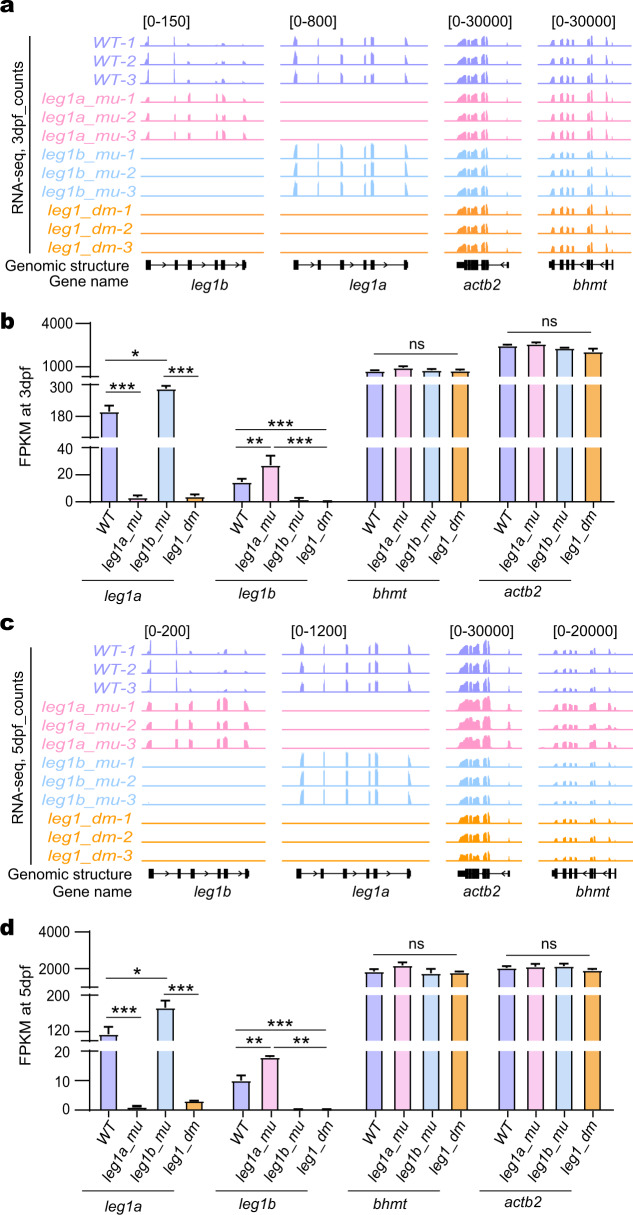
Fig. 2
a–d Genome browser view (a, c) and statistical analysis (b, d) of leg1a and leg1b transcript counts (FPKM) together with actb2 and bhmt two control genes in RNA-seq samples obtained from WT, leg1a_mu single, leg1b_mu single and leg1_dm double mutant embryos at 3 dpf (a, b) and at 5 dpf (c, d), respectively. ns, no significance; *P < 0.05; **P < 0.01; ***P < 0.001.
Acknowledgments
This image is the copyrighted work of the attributed author or publisher, and
ZFIN has permission only to display this image to its users.
Additional permissions should be obtained from the applicable author or publisher of the image.
Full text @ Cell Discov