
|
Fig. 3
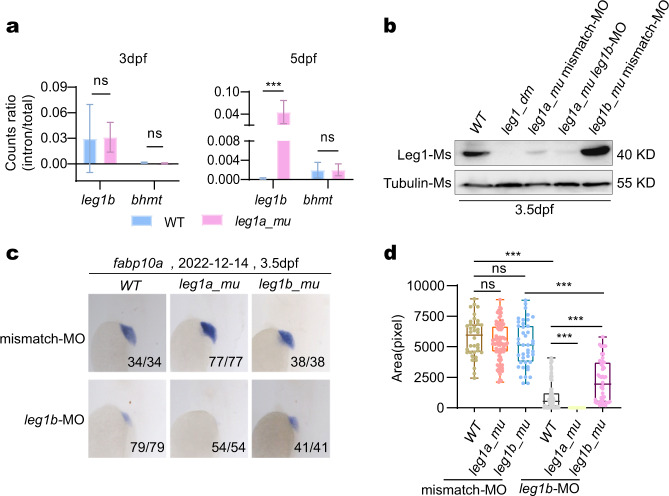
a Statistical analysis of the ratios of the precursor and total leg1b transcripts in WT and leg1azju1/zju1 at 3 dpf and 5 dpf, respectively. Nine RNA-seq datasets each for WT and leg1azju1/zju1 at 3 dpf and 5 dpf were used for this analysis (refer to Supplementary Tables S1, S2, S7, S8, S13, S14). b Western blot of Leg1 from embryos at 3.5 dpf after injection of leg1b-MO in different genotypes as shown. Tubulin, loading control. c, d Representative images showing the WISH result using the fabp10a probe (c) and statistical analysis of the liver size (d) in different genotypes injected with leg1b-MO or control mismatch morpholino (mismatch-MO) as indicated. c Top: the date of experiments performed; bottom right: number of embryos showing the phenotype over total embryos examined. d The y axis shows the positive signal area in each embryo stained with the fabp10a probe.