
|
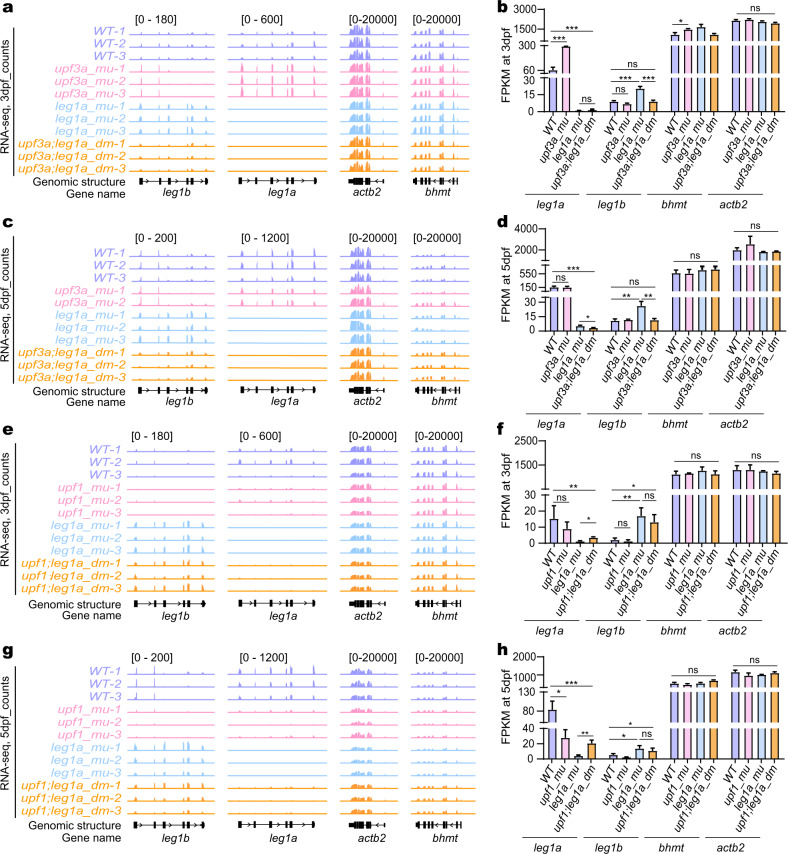
Fig. 5
a–d Showing genome browser view (a, c) and statistical analysis (b, d) of leg1a and leg1b transcript counts (FPKM) together with actb2 and bhmt two control genes in RNA-seq samples obtained from WT, upf3a−/− (upf3a_mu) single, leg1azju1/zju1 (leg1a_mu) single and upf3a−/−leg1azju1/zju1 (upf3a;leg1a_dm) double mutant embryos at 3 dpf (a, b) and at 5 dpf (c, d), respectively. e–h Genome browser view (e, g) and statistical analysis (f, h) of leg1a and leg1b transcript counts (FPKM) together with actb2 and bhmt two control genes in RNA-seq samples obtained from WT, upf1−/− (upf1_mu) single, leg1azju1/zju1 (leg1a_mu) single and upf1−/−leg1azju1/zju1 (upf1;leg1a_dm) double mutant embryos at 3 dpf (e, f) and at 5 dpf (g, h), respectively. ns, no significance; *P < 0.05; **P < 0.01; ***P < 0.001.