
Image
|
Figure Caption
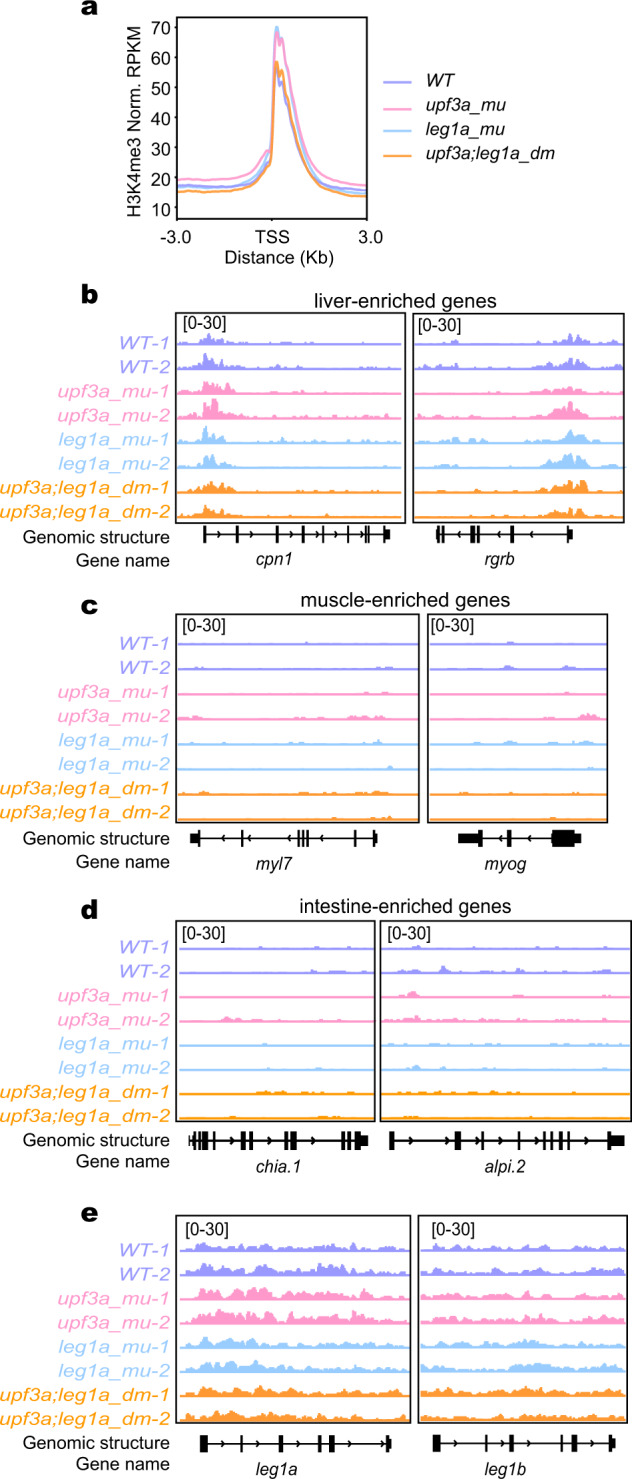
Fig. 7
a Graph showing the normalized reads distribution profiles of the genome-wide H3K4me3 enrichment (RPKM) in the liver dissected from WT, leg1a_mu, upf3a_mu and upf3a;leg1a_dm embryos at 5 dpf. TSS, transcription start site. b–e Genome browser view of the H3K4me3 enrichment in the genomic region of representative liver-specific (b), muscle-enriched (c), intestine-enriched genes (d) and leg1a and leg1b (e) genes. The y axis shows the ULI-NChIP counts across the genomic region shown.
Acknowledgments
This image is the copyrighted work of the attributed author or publisher, and
ZFIN has permission only to display this image to its users.
Additional permissions should be obtained from the applicable author or publisher of the image.
Full text @ Cell Discov