FIGURE SUMMARY
Title

Patient-derived zebrafish xenografts of uveal melanoma reveal ferroptosis as a drug target

Authors
Groenewoud, A., Yin, J., Gelmi, M.C., Alsafadi, S., Nemati, F., Decaudin, D., Roman-Roman, S., Kalirai, H., Coupland, S.E., Jochemsen, A.G., Jager, M.J., Engel, F.B., Snaar-Jagalska, B.E.
Source
Full text @ Cell Death Discov

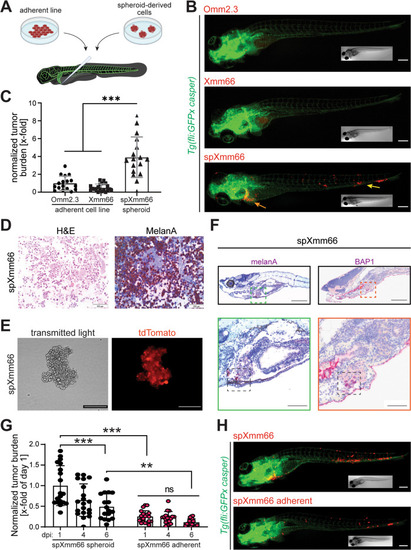
Generation of highly metastatic uveal melanoma in zebrafish from spheroid cultures.

A Scheme representing the approach to inject metastatic uveal melanoma in zebrafish. Spheroid cultures are reduced to single cell suspensions by enzymatic dissociation, and single cells are injected through the Duct of Cuvier (doC) into the blood circulation of 48 hpf Tg(fli:GFPx casper) zebrafish larvae, in which all vessels are labelled with GFP (green). B Stereomicroscopic images of representative phenotypes of Tg(fliGFPx casper) zebrafish larvae 6 days post injection with lentivirally labelled cells (red) derived from the commonly used UM cell lines Omm2.3 and Xmm66 compared to spheroid-derived Xmm66 cells (spXmm66). Scale bars: 100 μm. Inserts: same fish imaged with bright field microscopy. C Quantitative analysis of the metastatic capacity of adherent uveal melanoma Omm2.3 and Xmm66 cells and UM-derived spheroid line spXmm66 upon engraftment into zebrafish (n = 20). Data are mean ± SD. D Analysis of spXmm66 by H&E as well as melanA staining (marker for the melanocytic origin of the engrafted cells). E Microscopic images of the spXmm66 spheroid line in suspension after lentiviral transduction resulting in tdTomato expression. F Representative images of tissue sections of zebrafish engrafted with spXmm66 cells 6 days post injection stained for hematoxylin and eosin and BAP1 (dark purple, boxed area) or melanA (dark purple, boxed area). Scale bars: 1 mm (overview image), 500 µm (magnification). G Stereomicroscopic images of representative phenotypes of Tg(fliGFPx casper) zebrafish larvae 6 days post injection with tdTomato-labelled spXmm66 cells grown in suspension (spheroid) or as de novo adherent cultures (7 days conventional cell culture on plastic). Scale bars: 100 μm. Inserts: same fish imaged with bright field microscopy. H Quantitative analysis of the metastatic capacity of spXmm66 cells grown in suspension (spheroid) or as de novo adherent cultures upon engraftment into zebrafish (n = 20). Data are mean ± SD. ns: not significant. **:p < 0.01; ***:p < 0.001.

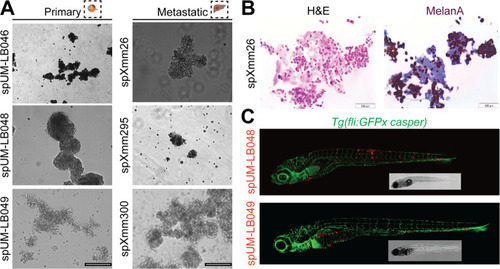
Spheroid cultures can readily be established from both primary uveal melanoma tumors and patient-derived metastatic uveal melanoma tissues derived from murine xenografts.

A Representative image of the established spheroid cultures. Primary: uveal melanoma patient tumor tissue. Metastatic: murine xenograft material, derived from metastatic UM samples propagated subcutaneously. Scale bars: 250 µm). B Analysis of spXmm26 by H&E as well as melanA staining (marker for the melanocytic origin of the engrafted cells). C Stereomicroscopic images of representative phenotypes of Tg(fliGFPx casper) zebrafish larvae (blood vessels: green) 6 days post injection with CM-DiL-labelled spheroid cells (spUM-LB048 and spUM-LB049, red) derived from primary uveal melanoma tumor tissues. Note, disseminated cancer cells are present up to 6 days post engraftment and settle in both the hematopoietic tissue and/or the liver. Inserts: same fish imaged with bright field microscopy.

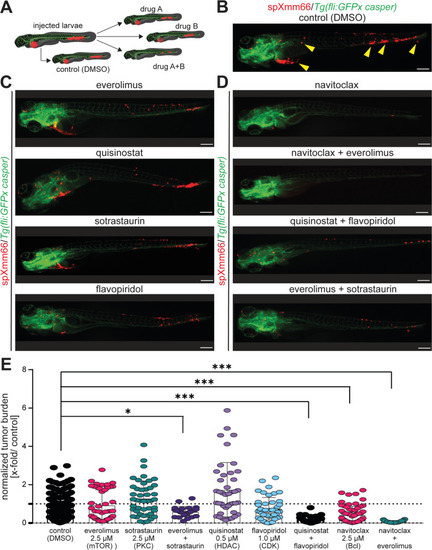
Metastatic uveal melanoma zebrafish model is suitable for drug screening.

A Scheme representing the approach to perform drug screening in the here established metastatic uveal melanoma zebrafish model utilizing spXmm66 cell engraftment at 48 hpf followed by tumor burden analysis 6 dpi. BD Stereomicroscopic images of representative phenotypes of Tg(fliGFPx casper) zebrafish larvae 6 days post injection with tdTomato-labelled spXmm66 cells and treatment with the indicated drugs at their maximum tolerated dose (>80% survival, Supplementary Fig. 1). Scale bars: 250 µm. E Quantitative analysis of (BD) to determine the effect of the indicated drug treatment on tumor burden, normalized to DMSO control (normalized tumor burden). Data are mean ± SD. *:p < 0.05; **:p < 0.01; ***:p < 0.001.

Ferroptosis-related genes negatively correlate with uveal melanoma patient survival.

A, Analysis of the UM-specific survival in both LUMC and TCGA patient cohorts. B, C High GPX4 (B) and SLC7A11 (C) expression levels (divided over the median) show a correlation with reduced patient survival (p = 0.004 and p = 0.0014, respectively). D, E Comparative analysis of the relation between GPX4 (D) and SLC7A11 (E) and survival in BAP1+ (LUMC, determined by IHC, n = 25) and BAP1 high (TCGA, determined by RNAseq, n = 40) UM samples compared to survival in BAP1- (LUMC, IHC, n = 31) and BAP1 low (TCGA, RNAseq, n = 40) UM samples. The expression levels of GPX4, SLC7A11 and BAP1 were split at the median, and curves were plotted using SPSS.

Ferroptosis induction inhibits metastasis formation in the metastatic uveal melanoma zebrafish model.

A Western blot analysis determining GPX4, SLC7A11 and BAP1 protein expression in the two established cell lines MM66 and MM 46 and eight patient-derived tissues. Loading control: vinculin. Note, while BAP1 and GPX4 show a negative correlation in the patient samples, SLC7A11 was barely detected, independent of BAP1 expression levels. B, B’ Westernblot quantification of BAP1, SLC7A11 and GPX4. C qPCR analysis of GPX4 mRNA expression in primary UM tissues and spXmm66 (green dots), with known BAP1 status. Expression values were normalized to GAPDH (ΔCT). n = 3. D Quantitative analysis of tumor burden in the here established metastatic uveal melanoma zebrafish model. The indicated cells were engrafted at 48 hpf, maintained for 6 days in the absence or presence of the ferroptosis inducer erastin (SLC7A11 inhibitor, 5 μM) or RSL3 (GPX4 inhibitor, 10 μM) and subsequently subjected to tumor burden analysis. Notably, ferroptosis induction via erastin and/or RSL3 resulted in 4 out of 5 cases in a significant reduction of tumor burden. n = 40 (spXmm66) or n = 20 (all other cases). Data are mean ± SD. D3: chromosome 3 disomy: M3: chromosome 3 monosomy. ns: not significant. ***:p < 0.001.

Acknowledgments
This image is the copyrighted work of the attributed author or publisher, and ZFIN has permission only to display this image to its users. Additional permissions should be obtained from the applicable author or publisher of the image. Full text @ Cell Death Discov