IMAGE

Fig. 1

ID
ZDB-IMAGE-230619-11
Source
Figures for Groenewoud et al., 2023
Image
Figure Caption

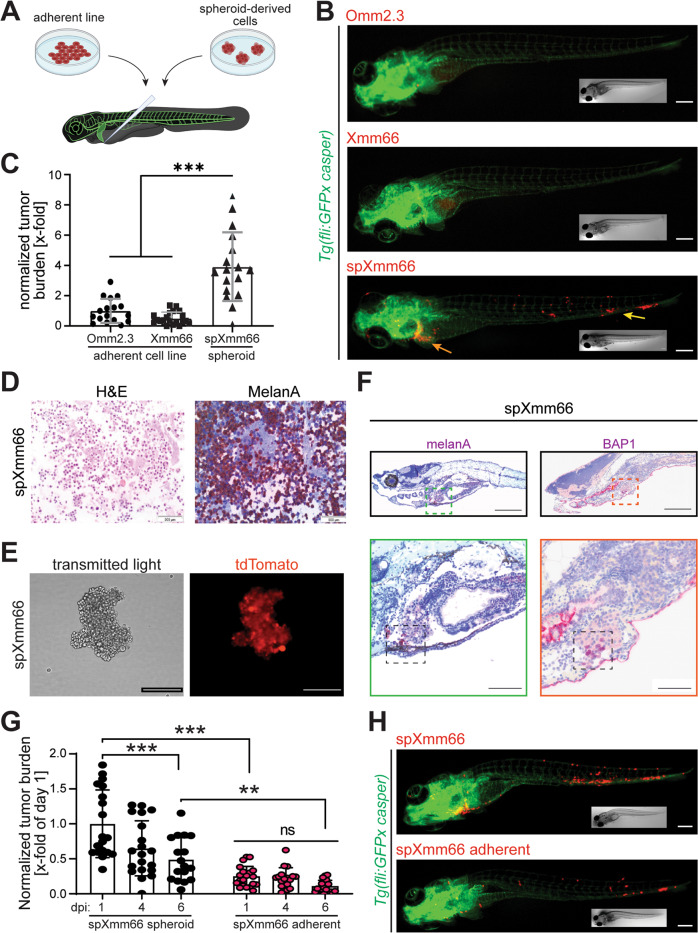
Fig. 1 Generation of highly metastatic uveal melanoma in zebrafish from spheroid cultures.

A Scheme representing the approach to inject metastatic uveal melanoma in zebrafish. Spheroid cultures are reduced to single cell suspensions by enzymatic dissociation, and single cells are injected through the Duct of Cuvier (doC) into the blood circulation of 48 hpf Tg(fli:GFPx casper) zebrafish larvae, in which all vessels are labelled with GFP (green). B Stereomicroscopic images of representative phenotypes of Tg(fliGFPx casper) zebrafish larvae 6 days post injection with lentivirally labelled cells (red) derived from the commonly used UM cell lines Omm2.3 and Xmm66 compared to spheroid-derived Xmm66 cells (spXmm66). Scale bars: 100 μm. Inserts: same fish imaged with bright field microscopy. C Quantitative analysis of the metastatic capacity of adherent uveal melanoma Omm2.3 and Xmm66 cells and UM-derived spheroid line spXmm66 upon engraftment into zebrafish (n = 20). Data are mean ± SD. D Analysis of spXmm66 by H&E as well as melanA staining (marker for the melanocytic origin of the engrafted cells). E Microscopic images of the spXmm66 spheroid line in suspension after lentiviral transduction resulting in tdTomato expression. F Representative images of tissue sections of zebrafish engrafted with spXmm66 cells 6 days post injection stained for hematoxylin and eosin and BAP1 (dark purple, boxed area) or melanA (dark purple, boxed area). Scale bars: 1 mm (overview image), 500 µm (magnification). G Stereomicroscopic images of representative phenotypes of Tg(fliGFPx casper) zebrafish larvae 6 days post injection with tdTomato-labelled spXmm66 cells grown in suspension (spheroid) or as de novo adherent cultures (7 days conventional cell culture on plastic). Scale bars: 100 μm. Inserts: same fish imaged with bright field microscopy. H Quantitative analysis of the metastatic capacity of spXmm66 cells grown in suspension (spheroid) or as de novo adherent cultures upon engraftment into zebrafish (n = 20). Data are mean ± SD. ns: not significant. **:p < 0.01; ***:p < 0.001.

Acknowledgments
This image is the copyrighted work of the attributed author or publisher, and ZFIN has permission only to display this image to its users. Additional permissions should be obtained from the applicable author or publisher of the image. Full text @ Cell Death Discov