
- Title
-
In Vitro and In Vivo Effects of Ulvan Polysaccharides from Ulva rigida
- Authors
- García-Márquez, J., Moreira, B.R., Valverde-Guillén, P., Latorre-Redoli, S., Caneda-Santiago, C.T., Acién, G., Martínez-Manzanares, E., Marí-Beffa, M., Abdala-Díaz, R.T.
- Source
- Full text @ Pharmaceuticals (Basel)
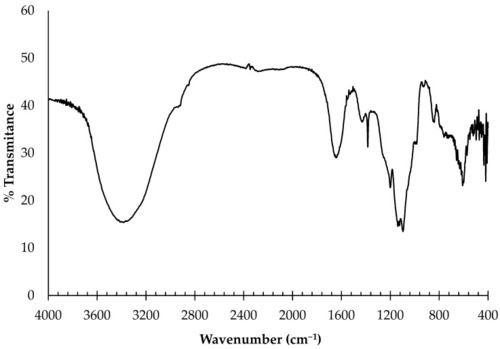
FTIR spectroscopy of ulvans from U. rigida. |
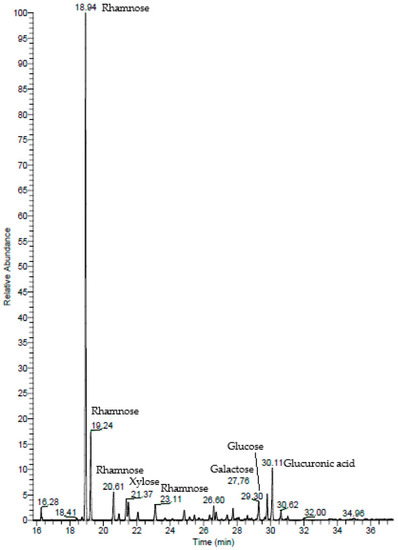
Gas chromatography–mass spectrometry (GC–MS) of ulvans from U. rigida. |
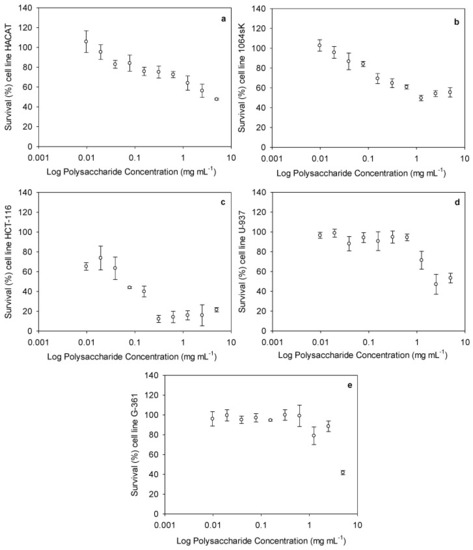
Cytotoxic activity of ulvan polysaccharides, expressed as survival (%) of each cell line depending on the ulvan polysaccharide concentration (mg mL−1). Each figure represents a cell line: (a) immortalized human keratinocytes (HACAT), (b) human fibroblasts (1064SK), (c) human colorectal carcinoma cell line (HCT-116), (d) human myeloid leukemia (U-937), and (e) human malignant melanoma (G-361). |
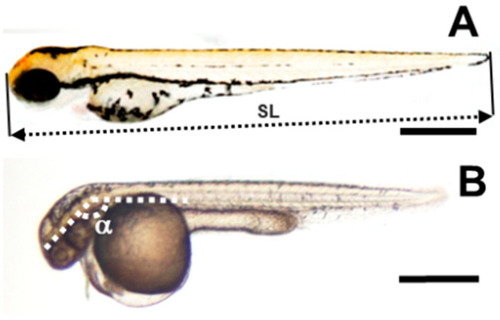
Standard length and head–trunk angle of zebrafish embryos. (A) Control untreated zebrafish embryos. The double discontinuous arrow shows the standard length (SL). (B) Polysaccharide-treated 72 hpf embryo. α indicates the head–trunk angle as suggested by Kimmel et al. [60]. Bars represent 500 µm. |
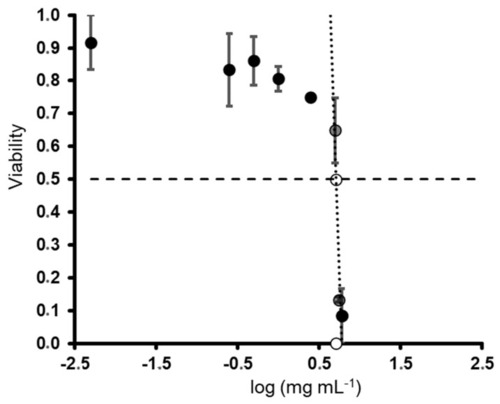
LC50 estimation for ulvan polysaccharide treatment of zebrafish 48 hpf embryos. Circles and vertical bars are the means and standard deviations of data from three replicates. Gray, transparent circles are data used to estimate the LC50. The empty circle intersects the regression line and 50 % viability. The white circle is the log (LC50) estimation. Linear adjustment is y = −7.2237x + 5.6279 (R2 = 0.8357). |
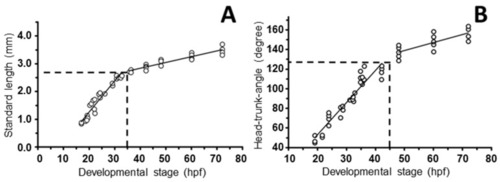
Linear functions used to transform standard lengths and head–trunk angles into hours of post-fertilization development. Graphs show the linear adjustments recovered from approximations to standard length (A) and head–trunk angle (B) data in Kimmel et al. [60] (Figures 16 and 33, respectively, of Kimmel et al. [60]). Data were obtained using ImageJ 1.50i (nih.gov, accessed on 13 January 2023). The variable transformation functions are (A) y = 0.0207x + 2.0153 (R2 = 0.8716; p ≈ 0.0000) (greater sizes); y = 0.1124x − 0.9848 (R2 = 0.931; p ≈ 0.0000) (lesser sizes); and (B) y = 0.8216x + 97.927 (R2 = 0.6126; p < 0.00059) (greater angles); y = 3.2744x − 12.452 (R2 = 0.9081; p < 0.000835) (lesser angles). Discontinuous lines represent the variable transformation limits. |
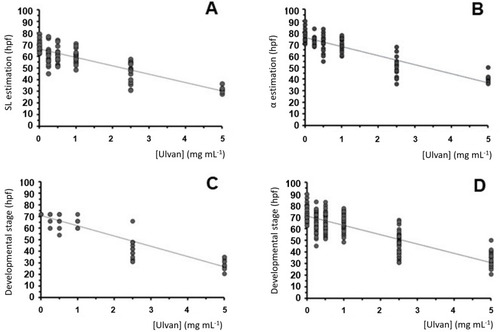
Embryo stage estimation after anatomical variable transformation using data from Kimmel et al. [60] (see Figure 4). (A–C) Linear regressions of standard length (A), head–trunk α angle (B), and anatomical-based estimations (C) with respect to the ulvan concentration. (D) Linear reduction in the compound stage estimation (A + B + C) with respect to the ulvan concentration. The linear adjustments are (A) y = −7.2x + 66.234 (R2 = 0.7232; p ≈ 0.0000), (B) y = −7.3294x + 76.026 (R2 = 0.8003; p < 0.00015), (C) y = −8.8x + 70.857 (R2 = 0.8738; p ≈ 0.0000), and (D) y = −7.88x + 71.036 (R2 = 0.7479; p < 0.000085). |
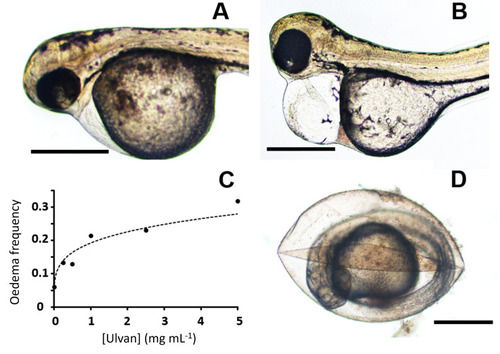
Pericardial edema and chorion lysis increase with the ulvan polysaccharide concentration. Slight (A) and significant (B) pericardial edemas are seen in zebrafish embryos treated with a 0.25 mg mL−1 ulvan concentration. (C) Exponential regression of edema frequency versus ulvan polysaccharide concentrations (y = 0.0386x0.2325, R2 = 0.9351). (D) Chorion lysis observed at 2.5 mg mL−1 ulvan. Bars represent 500 µm. |