
Image
|
Figure Caption
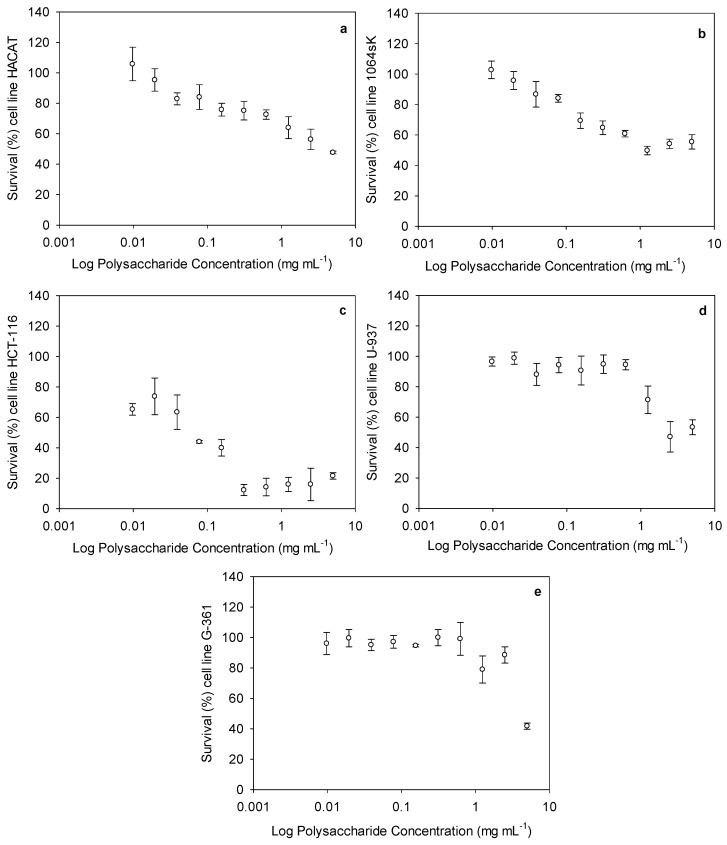
Figure 3
Cytotoxic activity of ulvan polysaccharides, expressed as survival (%) of each cell line depending on the ulvan polysaccharide concentration (mg mL−1). Each figure represents a cell line: (a) immortalized human keratinocytes (HACAT), (b) human fibroblasts (1064SK), (c) human colorectal carcinoma cell line (HCT-116), (d) human myeloid leukemia (U-937), and (e) human malignant melanoma (G-361).
Acknowledgments
This image is the copyrighted work of the attributed author or publisher, and
ZFIN has permission only to display this image to its users.
Additional permissions should be obtained from the applicable author or publisher of the image.
Full text @ Pharmaceuticals (Basel)