
FIGURE
Figure 8
- ID
- ZDB-FIG-230529-147
- Publication
- García-Márquez et al., 2023 - In Vitro and In Vivo Effects of Ulvan Polysaccharides from Ulva rigida
- Other Figures
- All Figure Page
- Back to All Figure Page
Figure 8
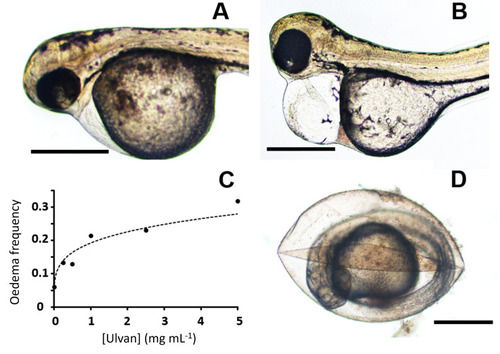
Pericardial edema and chorion lysis increase with the ulvan polysaccharide concentration. Slight (A) and significant (B) pericardial edemas are seen in zebrafish embryos treated with a 0.25 mg mL−1 ulvan concentration. (C) Exponential regression of edema frequency versus ulvan polysaccharide concentrations (y = 0.0386x0.2325, R2 = 0.9351). (D) Chorion lysis observed at 2.5 mg mL−1 ulvan. Bars represent 500 µm. |
Expression Data
Expression Detail
Antibody Labeling
Phenotype Data
Phenotype Detail
Acknowledgments
This image is the copyrighted work of the attributed author or publisher, and
ZFIN has permission only to display this image to its users.
Additional permissions should be obtained from the applicable author or publisher of the image.
Full text @ Pharmaceuticals (Basel)