
|
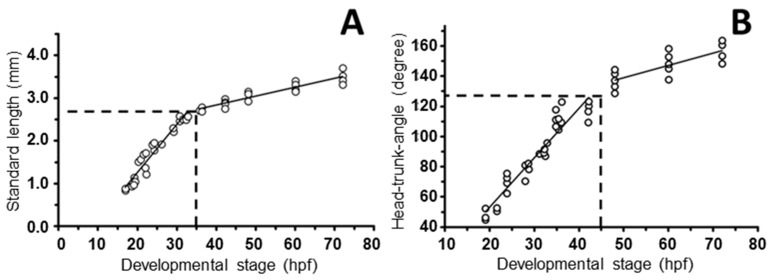
Figure 6
Linear functions used to transform standard lengths and head–trunk angles into hours of post-fertilization development. Graphs show the linear adjustments recovered from approximations to standard length (A) and head–trunk angle (B) data in Kimmel et al. [60] (Figures 16 and 33, respectively, of Kimmel et al. [60]). Data were obtained using ImageJ 1.50i (nih.gov, accessed on 13 January 2023). The variable transformation functions are (A) y = 0.0207x + 2.0153 (R2 = 0.8716; p ≈ 0.0000) (greater sizes); y = 0.1124x − 0.9848 (R2 = 0.931; p ≈ 0.0000) (lesser sizes); and (B) y = 0.8216x + 97.927 (R2 = 0.6126; p < 0.00059) (greater angles); y = 3.2744x − 12.452 (R2 = 0.9081; p < 0.000835) (lesser angles). Discontinuous lines represent the variable transformation limits.