
FIGURE
Figure 5
- ID
- ZDB-FIG-230529-144
- Publication
- García-Márquez et al., 2023 - In Vitro and In Vivo Effects of Ulvan Polysaccharides from Ulva rigida
- Other Figures
- All Figure Page
- Back to All Figure Page
Figure 5
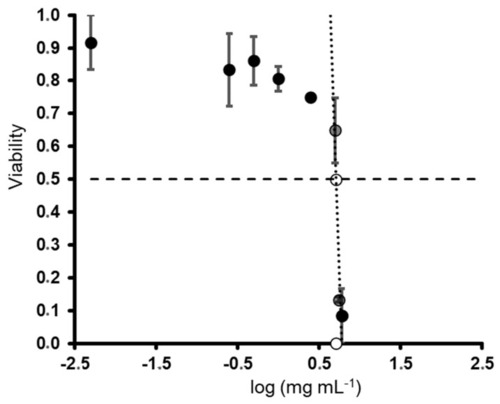
LC50 estimation for ulvan polysaccharide treatment of zebrafish 48 hpf embryos. Circles and vertical bars are the means and standard deviations of data from three replicates. Gray, transparent circles are data used to estimate the LC50. The empty circle intersects the regression line and 50 % viability. The white circle is the log (LC50) estimation. Linear adjustment is y = −7.2237x + 5.6279 (R2 = 0.8357). |
Expression Data
Expression Detail
Antibody Labeling
Phenotype Data
Phenotype Detail
Acknowledgments
This image is the copyrighted work of the attributed author or publisher, and
ZFIN has permission only to display this image to its users.
Additional permissions should be obtained from the applicable author or publisher of the image.
Full text @ Pharmaceuticals (Basel)