
Image
|
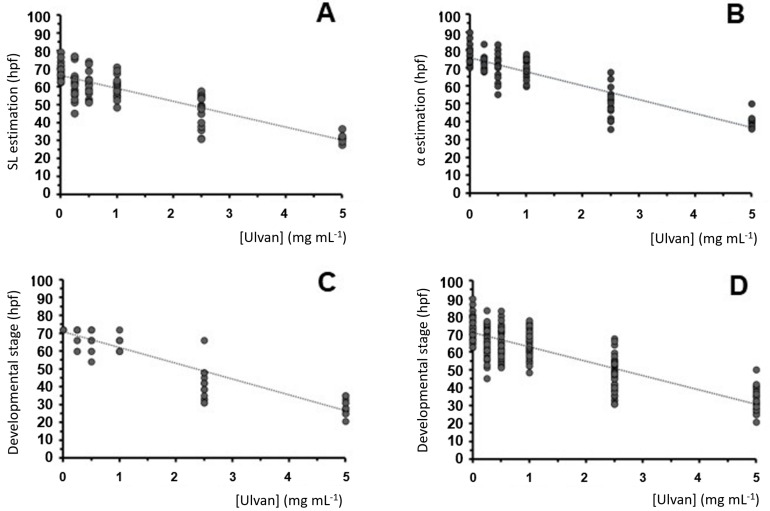
Figure Caption
Figure 7
Embryo stage estimation after anatomical variable transformation using data from Kimmel et al. [60] (see Figure 4). (A–C) Linear regressions of standard length (A), head–trunk α angle (B), and anatomical-based estimations (C) with respect to the ulvan concentration. (D) Linear reduction in the compound stage estimation (A + B + C) with respect to the ulvan concentration. The linear adjustments are (A) y = −7.2x + 66.234 (R2 = 0.7232; p ≈ 0.0000), (B) y = −7.3294x + 76.026 (R2 = 0.8003; p < 0.00015), (C) y = −8.8x + 70.857 (R2 = 0.8738; p ≈ 0.0000), and (D) y = −7.88x + 71.036 (R2 = 0.7479; p < 0.000085).
Acknowledgments
This image is the copyrighted work of the attributed author or publisher, and
ZFIN has permission only to display this image to its users.
Additional permissions should be obtained from the applicable author or publisher of the image.
Full text @ Pharmaceuticals (Basel)