
- Title
-
A heterozygous mutation in UBE2H in a patient with developmental delay leads to an aberrant brain development in zebrafish
- Authors
- Shin, U., Choi, Y., Ko, H.S., Myung, K., Lee, S., Cheon, C.K., Lee, Y.
- Source
- Full text @ Hum. Genomics
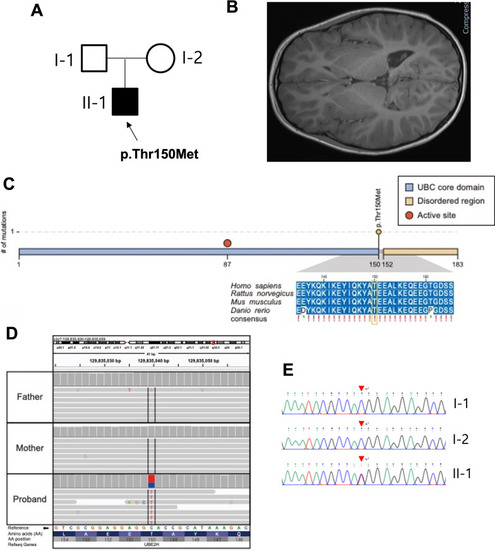
A de novo mutation of UBE2h was found in a patient with neural development defects in the brain. A Pedigree of the present family. The proband has been indicated using an arrow. The affected male has been designated using the filled symbol (squares for males and circles for females). B Brain magnetic resonance imaging (MRI) scans of the patient with dolichocephaly. C The variant (c.449C>T, p.Thr150Met) was located in the UBC core domain of UBE2H and was perfectly conserved in four model species according to multiple sequence alignment analyses. D. IGV snapshot of the variant (c.449C>T, p.Thr150Met). E. Sanger sequencing confirmed a heterozygous missense variant (c.887A>G, p.Thr150Met) of the UBE2H gene (NM_001202498) that had been identified using whole-genome sequencing of the affected patient genome (II-1) |
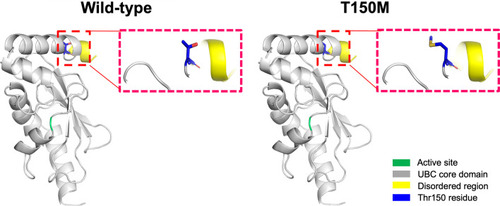
Structure homology-modeling of the normal human UBE2H and T150M variant. By means of in silico protein structure modeling, wild-type and mutant residues (p.Thr150Met) in the UBE2H protein have been represented as sticks alongside the surrounding residues. The Thr150 residue is located in the UBC core domain away from the active site. The crystal structure of the domain from wild-type UBE2H was generated using SWISS-MODEL (https://swissmodel.expasy.org/) and has been depicted as a cartoon representation |
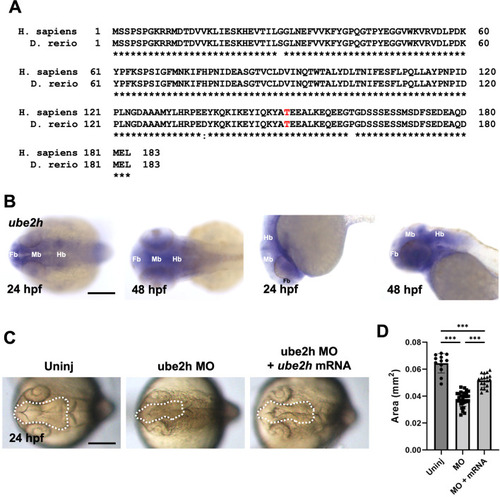
Ube2h is required for normal brain development. |
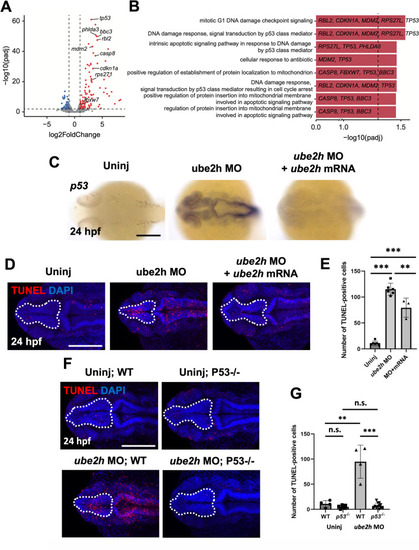
The p53-dependent apoptosis signaling pathway is highly activated in the ube2h morphant. A Volcano plot showing differentially expressed genes in the ube2h morphants. The red dots represent significantly upregulated genes, while blue dots represent downregulated genes in the ube2h morphants. B Visualization of the GO BP pathways significantly enriched with the differentially expressed genes in the ube2h morphants. C Dorsal view of p53 WISH using ube2h MO-injected embryos, both ube2h MO and ube2h mRNA co-injected embryos, and uninjected controls, at 24 hpf. D Representative images of confocal microscopy of TUNEL staining in the brains of ube2h morphants, both ube2h MO and ube2h mRNA co-injected embryos, and uninjected controls at 24 hpf. E Quantification of the number of TUNEL-positive cells in the brains from D. F Confocal microscopy images of TUNEL-stained brains (white dotted area) of ube2h morphants and uninjected controls with either WT or p53−/− background, at 24 hpf. G Quantification of the number of TUNEL-positive cells in the brains (white dotted area) from F. All graphs represent mean ± S.E.M. of individual values. p values were calculated using an unpaired two-tailed Student’s t test. *** p < 0.001; *p < 0.05; n.s., not significantly different. Scale bar: 200 μm |
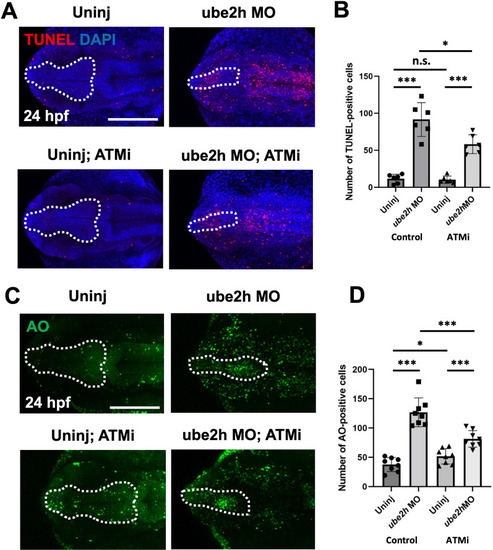
The ATM-p53 pathway activated apoptosis in the brain of ube2h morphants. A Representative confocal microscopy images of TUNEL-stained 24 hpf ube2h morphants treated with ATMi, KU60019. B Quantification of the number of TUNEL-positive cells in the brains (White dotted area) from A. C Confocal microscopy images of AO staining in the brains of 24 hpf ube2h morphants treated with ATMi. D Quantification of the number of AO-positive cells in the brains from C. The white dotted area indicates the brain area including forebrain and midbrain. The graphs represent mean ± S.E.M. of individual values. The p values were calculated using an unpaired two-tailed Student’s t test. ***p < 0.001; *p < 0.05; n.s., not significantly different. Scale bar: 200 μm. ATMi, ATM inhibitor PHENOTYPE:
|
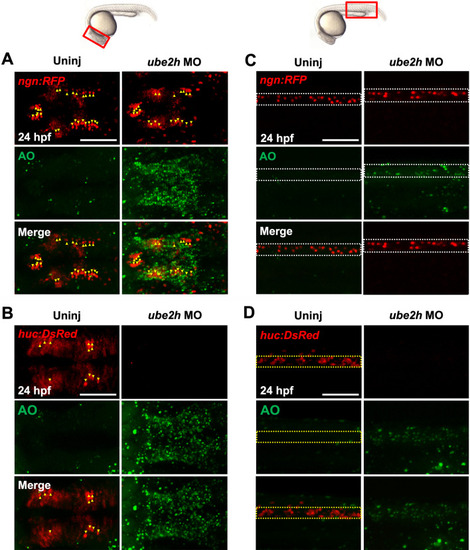
Depletion of ube2h disrupts the maintenance of neurons during zebrafish embryogenesis. A, B Dorsal view of confocal microscopy images of AO staining (Green) of the brains of ube2h morphants and uninjected controls with the transgenic background of either ngn:RFP (A) or huc:DsRed ( PHENOTYPE:
|
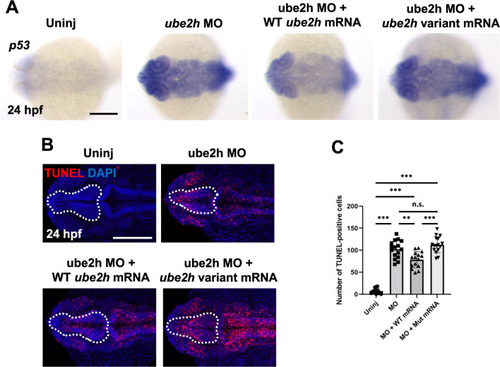
A Threonine to Methionine mutation at the 150th amino acid of Ube2h disrupts regulation of p53-dependent apoptosis. A Induction of p53 expression in the ube2h morphant was recovered upon co-injection of WT ube2h mRNA with MO, but not upon co-injection of patient-mimicking ube2h variant mRNA with MO. B Representative confocal microscopy images of TUNEL staining in the brains of 24 hpf WT embryos injected with ube2h MO, ube2h MO with WT ube2h mRNA, and ube2h MO with patient-mimicking ube2h variant mRNA. C Quantification of the number of TUNEL-positive cells in the brains from B. All graphs represent mean ± S.E.M. of individual values. p values were calculated using an unpaired two-tailed Student’s t test. ***p < 0.001; **p < 0.01; n.s., not significantly different. Scale bar: 200 μm |