
|
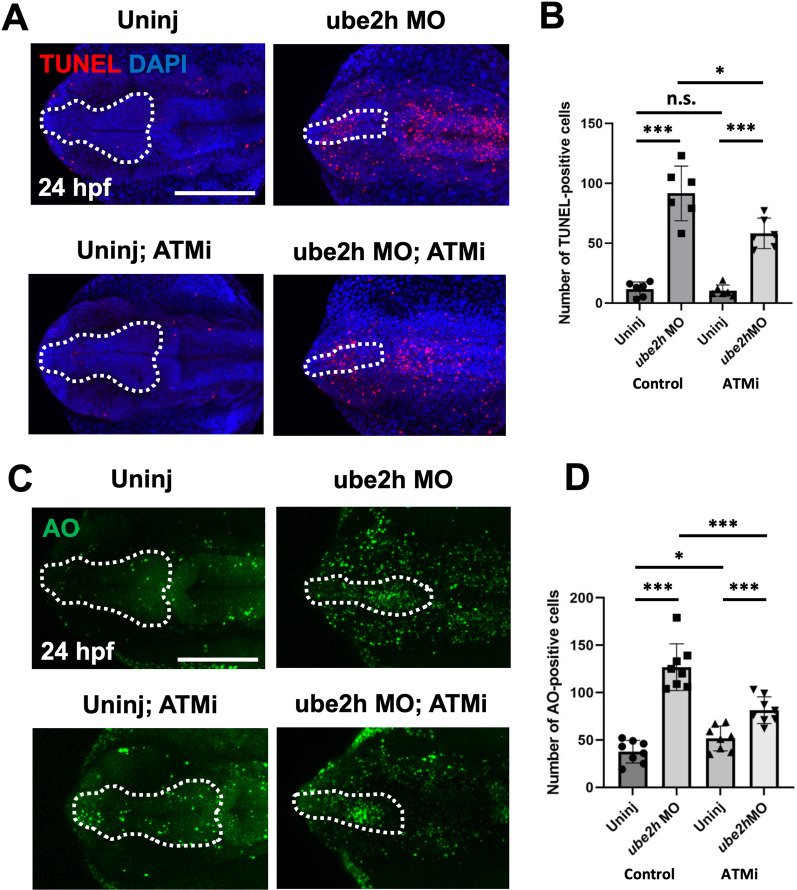
Fig. 5
The ATM-p53 pathway activated apoptosis in the brain of ube2h morphants. A Representative confocal microscopy images of TUNEL-stained 24 hpf ube2h morphants treated with ATMi, KU60019. B Quantification of the number of TUNEL-positive cells in the brains (White dotted area) from A. C Confocal microscopy images of AO staining in the brains of 24 hpf ube2h morphants treated with ATMi. D Quantification of the number of AO-positive cells in the brains from C. The white dotted area indicates the brain area including forebrain and midbrain. The graphs represent mean ± S.E.M. of individual values. The p values were calculated using an unpaired two-tailed Student’s t test. ***p < 0.001; *p < 0.05; n.s., not significantly different. Scale bar: 200 μm. ATMi, ATM inhibitor