
|
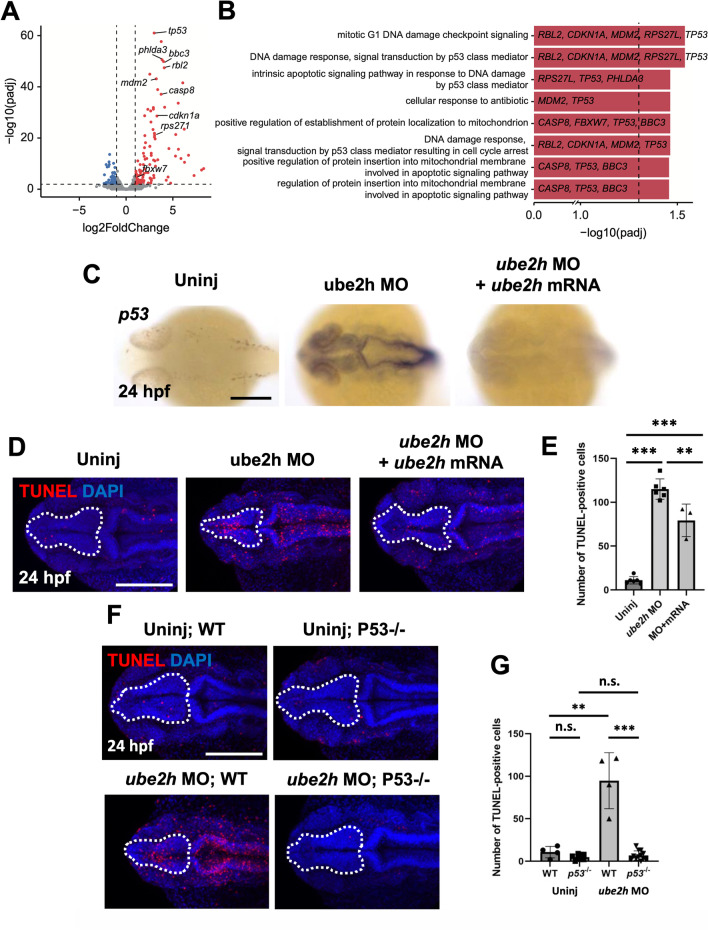
Fig. 4
The p53-dependent apoptosis signaling pathway is highly activated in the ube2h morphant. A Volcano plot showing differentially expressed genes in the ube2h morphants. The red dots represent significantly upregulated genes, while blue dots represent downregulated genes in the ube2h morphants. B Visualization of the GO BP pathways significantly enriched with the differentially expressed genes in the ube2h morphants. C Dorsal view of p53 WISH using ube2h MO-injected embryos, both ube2h MO and ube2h mRNA co-injected embryos, and uninjected controls, at 24 hpf. D Representative images of confocal microscopy of TUNEL staining in the brains of ube2h morphants, both ube2h MO and ube2h mRNA co-injected embryos, and uninjected controls at 24 hpf. E Quantification of the number of TUNEL-positive cells in the brains from D. F Confocal microscopy images of TUNEL-stained brains (white dotted area) of ube2h morphants and uninjected controls with either WT or p53−/− background, at 24 hpf. G Quantification of the number of TUNEL-positive cells in the brains (white dotted area) from F. All graphs represent mean ± S.E.M. of individual values. p values were calculated using an unpaired two-tailed Student’s t test. *** p < 0.001; *p < 0.05; n.s., not significantly different. Scale bar: 200 μm