
- Title
-
Multi-omics analysis of a drug-induced model of bipolar disorder in zebrafish
- Authors
- Li, Y., Zhang, L., Mao, M., He, L., Wang, T., Pan, Y., Zhao, X., Li, Z., Mu, X., Qian, Y., Qiu, J.
- Source
- Full text @ iScience
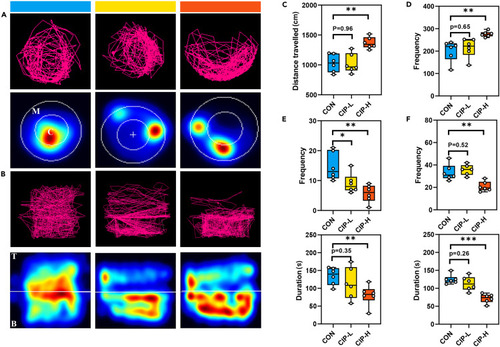
Behavioral phenotypes of control (CON) versus zebrafish model of BD We tracked the swimming behavior of zebrafish within 5 min, covering the swimming trajectory, frequency of occurrence of manic-like behavior, total duration and frequency of movement to the top and central zones (CON, Zebrafish were reared in clear water for 4 weeks, n = 6; CIP-L, zebrafish were exposed to100 μg/L concentration levels of ciprofloxacin for 4 weeks, n = 6; CIP-H, zebrafish were exposed to1000 μg/L concentration levels of ciprofloxacin for 4 weeks, n = 6). (A and B) Representative locomotor trajectory plots and heat maps of zebrafish in the horizontal (A) and vertical (B) position preference test (C, central zone; M, marginal zone; T, top zone; B, bottom zone). (C–E) Box and Whisker plots of distance traveled (C), frequency of manic-like behavior (D) and total duration and frequency of movement to the central zones (E) in zebrafish in the horizontal position preference test. (F) Box and Whisker plots of total duration and frequency of movement to the top zones in zebrafish in the vertical position preference test. Data are shown as mean ± SEM, ∗p < 0.05, ∗∗p < 0.01, ∗∗∗p < 0.001, unpaired two-tailed Student’s t test. |
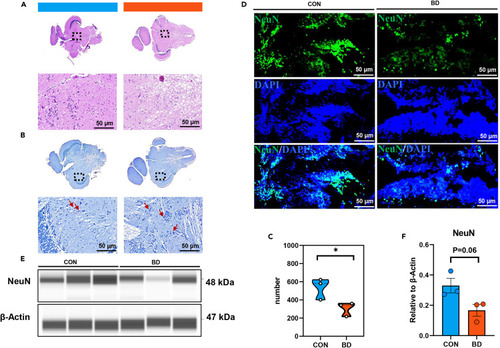
Histopathological characteristics of BD zebrafish (A and B) Histomorphometric analysis of midbrain from CON (n = 3) and BD zebrafish (n = 3) stained with H&E, scale bar = 50 μm (A); Nissl staining was used to mark Nissl bodies in neurons (B). Red arrow, cytosolic swelling, scale bar = 50 μm. (C) Total number of Nissl-positive neurons in per field was quantified with ImageJ. (D) Representative immunofluorescence images of midbrain after staining for NeuN (neurons, green) and DAPI (all nuclei, blue). Scale bar = 50 μm. (E and F) Expression of NeuN in CON and BD was detected by Western blot. Data are shown as mean ± SEM, ∗p < 0.05. |
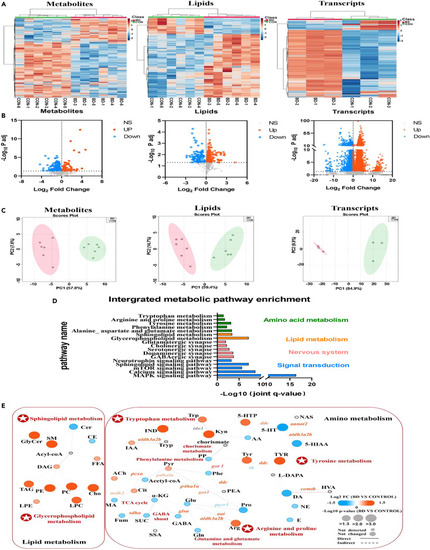
Multi-omic molecular profile of BD zebrafish (A) Hierarchical clustering analysis of metabolites, lipids and genes in brain tissues of CON and BD zebrafish. (B) Volcano plots for metabolomic, lipidomic and transcriptomic analysis in BD brain tissue. FDR < 0.05 and fold change > 1 were defined as significantly upregulated molecules; FDR < 0.05 and fold change < 1 were defined as significantly downregulated molecules. Red dots indicate significantly upregulated molecules; blue dots indicate significantly downregulated molecules, and black dots indicate non-significantly different molecules. (C) Principal component analysis plots of all 661 metabolites, 643 lipids and 32057 transcripts clearly separate the profiles of BD from controls. (D) Significant enrichment pathways identified by integrated molecular pathway-level analysis, integrating metabolites, lipids and transcripts (FDR < 0.05). The enrichment pathways were categorized as follows: amino acids (green), lipids (orange), nervous system (pink), and signal transduction (blue). (E) Integrated network analysis combining multi-omic molecules using MetaboAnalyst and IMPaLA platform. Each node (circle) represents a metabolite or lipid (CON and BD, n = 6), and each edge connecting the nodes represents a transcript (CON and BD, n = 3) encoding an enzyme based on a biochemical relationship. Solid or dashed connecting lines represent biochemical reactions that occur directly or indirectly. The size of each node reflects their p value. The shade of color represents the degree of relative change (blue indicates a decrease; red indicates an increase; gray indicates not detected). |

Dysregulated neurotransmission in BD zebrafish (A–E) Box and Whisker plots of brain amino acid neurotransmitter glycine (A), monoamine neurotransmitters dopamine and serotonin (B), aromatic amino acids tyrosine and tryptophan (C), related metabolites involved in tryptophan metabolism (D), and amino acids arginine and proline (E). ∗p < 0.05, ∗∗p < 0.01, ∗∗∗p < 0.001, unpaired two-tailed Student’s t test or the Wilcoxon Rank-Sum Test. (F) Heatmap shows overall changes in genes related to amino acid metabolism regulating neurotransmission. (G and H) Violin plot of brain sphingolipid Cer and SM (G) and glycerophospholipid PC and PE (H). Cer, ceramides; SM, sphingomyelins; PC, phosphatidylcholines; PE, phosphatidylethanolamines. Data are shown as mean ± SEM, ∗p < 0.05, ∗∗p < 0.01, ∗∗∗p < 0.001, unpaired two-tailed Student’s t test. (I) Heatmap shows overall changes in genes related to lipid metabolism regulating neurotransmission (CON and BD, n = 6) and genes (CON and BD, n = 3). |
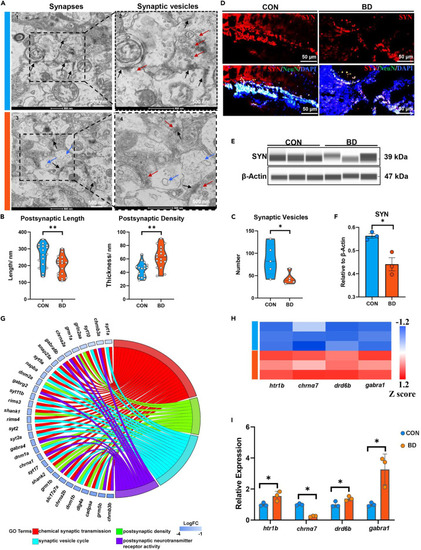
Synaptic damage in BD zebrafish (A) Representative electron synapses of midbrain from control and BD zebrafish (CON and BD, n = 3). Each image represents one individual subject (scale bar = 500 nm). (Black arrow, synapse; red arrow, synaptic vesicle; blue arrow, vacuolation.). (B and C) Quantitative measurements postsynaptic length, postsynaptic density (B) and synaptic vesicles (C) using ImageJ. 17 randomly selected fields of view from each sample were used to determine postsynaptic length and postsynaptic density; six randomly selected fields of view from each sample were used to determine synaptic vesicles. ∗p < 0.05, ∗∗p < 0.01, unpaired two-tailed Student’s t test. (D) Representative immunofluorescence images of midbrain after staining for SYN (synaptophysin, red), NeuN (neurons, green) and DAPI (all nuclei, blue). Scale bar = 50 μm. (E and F) Expression of SYN in CON and BD was detected by Western blot. ∗p < 0.05, unpaired two-tailed Student’s t test, data are shown as mean ± SEM. (G) Chord plot representation of 31 differentially expressed genes (FDR < 0.05) from four enriched pathways generated by the bioinformatic platform. The color map represents fold change (FC) of genes (log2 FC) and enriched pathways (chemical synaptic transmission, red; synaptic vesicle cycle, blue; postsynaptic density, green; postsynaptic neurotransmitter receptor activity, purple). (H and I) Quantitative analysis of genes regulating neurotransmitter receptor activity using transcriptome sequencing (H) and qPCR (I). chrnα7 related to cholinergic receptors; Htr1b related to serotonin receptors; drd5b related to dopamine receptors and gabra1 related to GABA receptors. ∗p < 0.05, unpaired two-tailed Student’s t test, data are shown as mean ± SEM. |
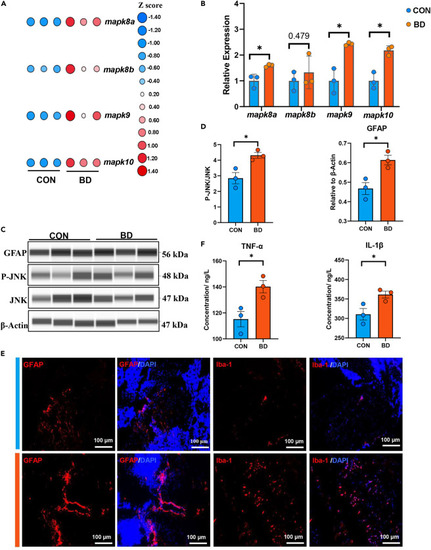
MAPK/JNK-mediated neuroinflammation in BD zebrafish (A) Heatmap shows overall changes in genes related to the MAPK/JNK signaling pathway. (B) Quantitative analysis of genes related to the MAPK/JNK signaling pathway using qPCR. (C and D) Expression of GFAP, P-JNK and JNK in CON and BD was detected by Western blot. ∗p < 0.05, unpaired two-tailed Student’s t test, data are shown as mean ± SEM. (E) Representative immunofluorescence images of midbrain after staining for GFAP (astrocyte, red), Iba-1 (microglia, red), NeuN (neurons, green), and DAPI (all nuclei, blue). Scale bar = 100 μm. (F) Quantitative analysis of pro-inflammatory cytokine levels using ELISA. ∗p < 0.05, unpaired two-tailed Student’s t test, data are shown as mean ± SEM (CON and BD, n = 3). |
|