
|
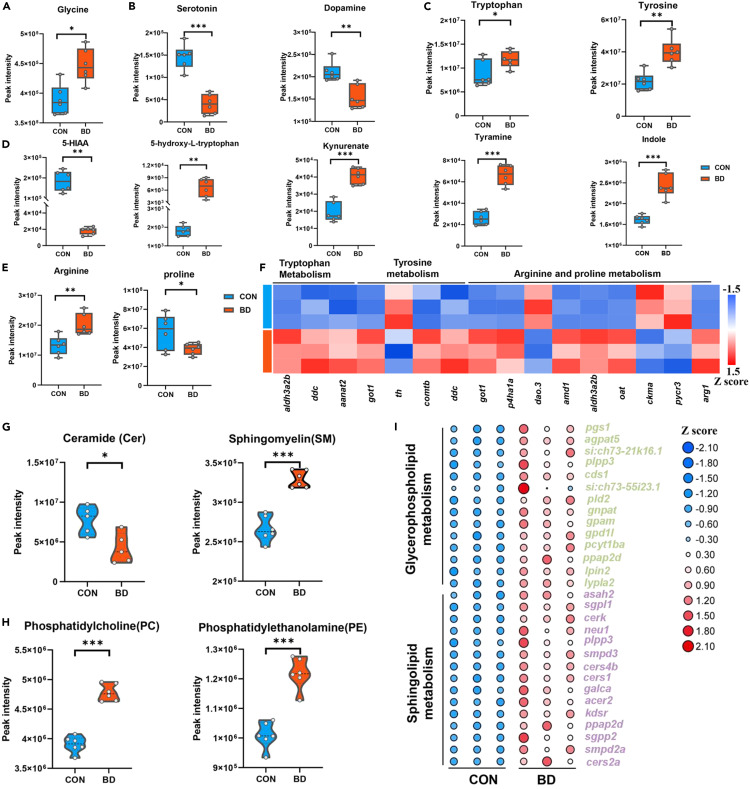
Fig. 4 Dysregulated neurotransmission in BD zebrafish (A–E) Box and Whisker plots of brain amino acid neurotransmitter glycine (A), monoamine neurotransmitters dopamine and serotonin (B), aromatic amino acids tyrosine and tryptophan (C), related metabolites involved in tryptophan metabolism (D), and amino acids arginine and proline (E). ∗p < 0.05, ∗∗p < 0.01, ∗∗∗p < 0.001, unpaired two-tailed Student’s t test or the Wilcoxon Rank-Sum Test. (F) Heatmap shows overall changes in genes related to amino acid metabolism regulating neurotransmission. (G and H) Violin plot of brain sphingolipid Cer and SM (G) and glycerophospholipid PC and PE (H). Cer, ceramides; SM, sphingomyelins; PC, phosphatidylcholines; PE, phosphatidylethanolamines. Data are shown as mean ± SEM, ∗p < 0.05, ∗∗p < 0.01, ∗∗∗p < 0.001, unpaired two-tailed Student’s t test. (I) Heatmap shows overall changes in genes related to lipid metabolism regulating neurotransmission (CON and BD, n = 6) and genes (CON and BD, n = 3).