
Fig. 6
- ID
- ZDB-FIG-240104-39
- Publication
- Li et al., 2023 - Multi-omics analysis of a drug-induced model of bipolar disorder in zebrafish
- Other Figures
- All Figure Page
- Back to All Figure Page
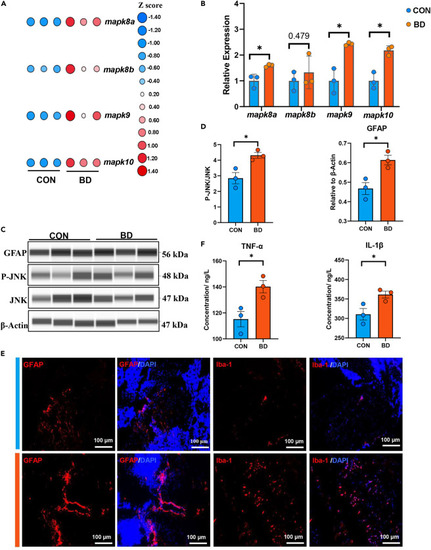
MAPK/JNK-mediated neuroinflammation in BD zebrafish (A) Heatmap shows overall changes in genes related to the MAPK/JNK signaling pathway. (B) Quantitative analysis of genes related to the MAPK/JNK signaling pathway using qPCR. (C and D) Expression of GFAP, P-JNK and JNK in CON and BD was detected by Western blot. ∗p < 0.05, unpaired two-tailed Student’s t test, data are shown as mean ± SEM. (E) Representative immunofluorescence images of midbrain after staining for GFAP (astrocyte, red), Iba-1 (microglia, red), NeuN (neurons, green), and DAPI (all nuclei, blue). Scale bar = 100 μm. (F) Quantitative analysis of pro-inflammatory cytokine levels using ELISA. ∗p < 0.05, unpaired two-tailed Student’s t test, data are shown as mean ± SEM (CON and BD, n = 3). |