
Fig. 2
- ID
- ZDB-FIG-240104-35
- Publication
- Li et al., 2023 - Multi-omics analysis of a drug-induced model of bipolar disorder in zebrafish
- Other Figures
- All Figure Page
- Back to All Figure Page
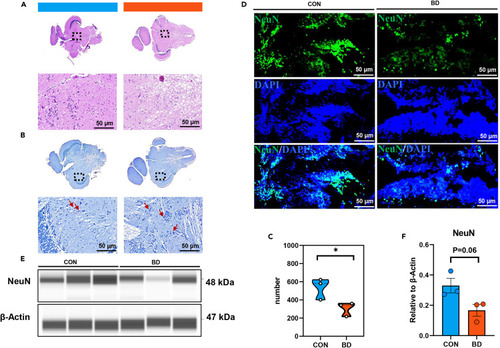
Histopathological characteristics of BD zebrafish (A and B) Histomorphometric analysis of midbrain from CON (n = 3) and BD zebrafish (n = 3) stained with H&E, scale bar = 50 μm (A); Nissl staining was used to mark Nissl bodies in neurons (B). Red arrow, cytosolic swelling, scale bar = 50 μm. (C) Total number of Nissl-positive neurons in per field was quantified with ImageJ. (D) Representative immunofluorescence images of midbrain after staining for NeuN (neurons, green) and DAPI (all nuclei, blue). Scale bar = 50 μm. (E and F) Expression of NeuN in CON and BD was detected by Western blot. Data are shown as mean ± SEM, ∗p < 0.05. |