
|
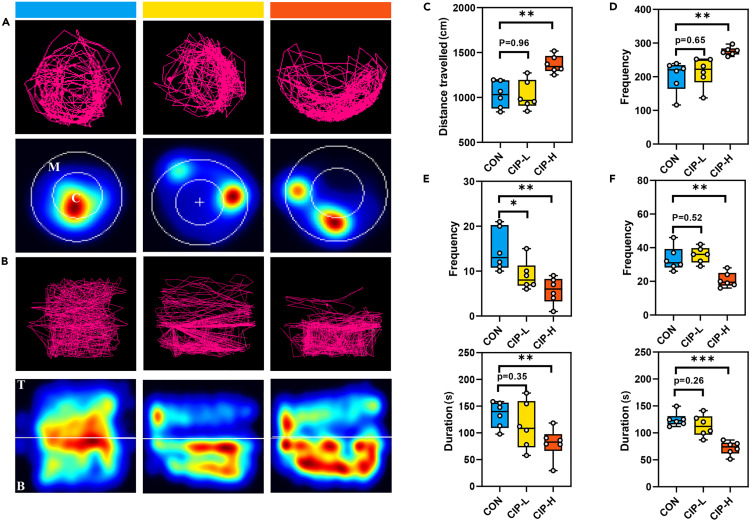
Fig. 1 Behavioral phenotypes of control (CON) versus zebrafish model of BD We tracked the swimming behavior of zebrafish within 5 min, covering the swimming trajectory, frequency of occurrence of manic-like behavior, total duration and frequency of movement to the top and central zones (CON, Zebrafish were reared in clear water for 4 weeks, n = 6; CIP-L, zebrafish were exposed to100 μg/L concentration levels of ciprofloxacin for 4 weeks, n = 6; CIP-H, zebrafish were exposed to1000 μg/L concentration levels of ciprofloxacin for 4 weeks, n = 6). (A and B) Representative locomotor trajectory plots and heat maps of zebrafish in the horizontal (A) and vertical (B) position preference test (C, central zone; M, marginal zone; T, top zone; B, bottom zone). (C–E) Box and Whisker plots of distance traveled (C), frequency of manic-like behavior (D) and total duration and frequency of movement to the central zones (E) in zebrafish in the horizontal position preference test. (F) Box and Whisker plots of total duration and frequency of movement to the top zones in zebrafish in the vertical position preference test. Data are shown as mean ± SEM, ∗p < 0.05, ∗∗p < 0.01, ∗∗∗p < 0.001, unpaired two-tailed Student’s t test.