
|
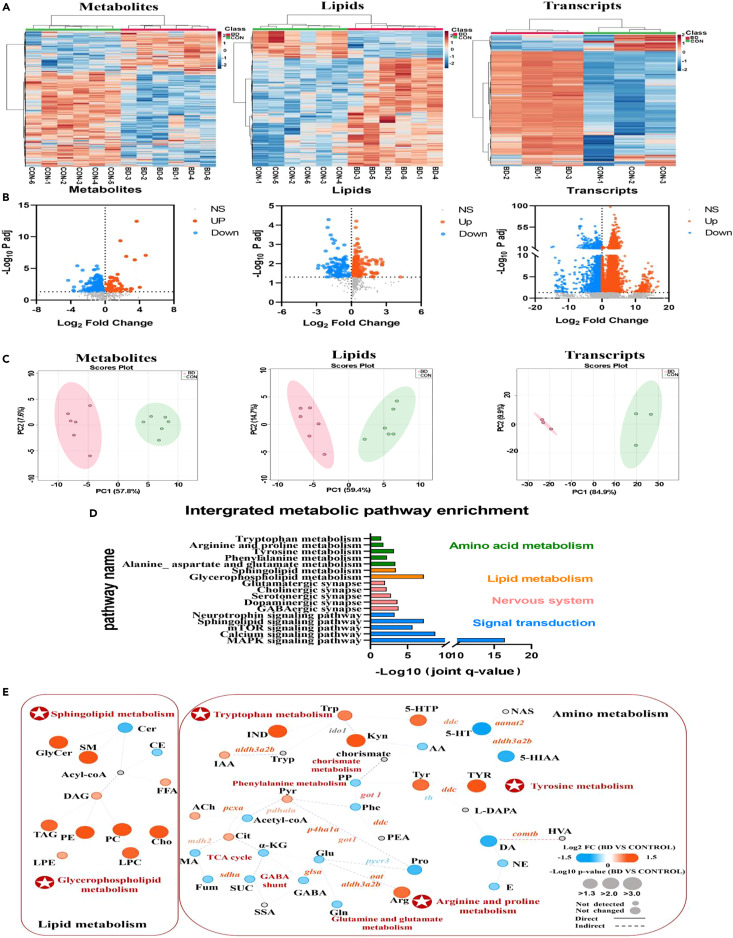
Fig. 3 Multi-omic molecular profile of BD zebrafish (A) Hierarchical clustering analysis of metabolites, lipids and genes in brain tissues of CON and BD zebrafish. (B) Volcano plots for metabolomic, lipidomic and transcriptomic analysis in BD brain tissue. FDR < 0.05 and fold change > 1 were defined as significantly upregulated molecules; FDR < 0.05 and fold change < 1 were defined as significantly downregulated molecules. Red dots indicate significantly upregulated molecules; blue dots indicate significantly downregulated molecules, and black dots indicate non-significantly different molecules. (C) Principal component analysis plots of all 661 metabolites, 643 lipids and 32057 transcripts clearly separate the profiles of BD from controls. (D) Significant enrichment pathways identified by integrated molecular pathway-level analysis, integrating metabolites, lipids and transcripts (FDR < 0.05). The enrichment pathways were categorized as follows: amino acids (green), lipids (orange), nervous system (pink), and signal transduction (blue). (E) Integrated network analysis combining multi-omic molecules using MetaboAnalyst and IMPaLA platform. Each node (circle) represents a metabolite or lipid (CON and BD, n = 6), and each edge connecting the nodes represents a transcript (CON and BD, n = 3) encoding an enzyme based on a biochemical relationship. Solid or dashed connecting lines represent biochemical reactions that occur directly or indirectly. The size of each node reflects their p value. The shade of color represents the degree of relative change (blue indicates a decrease; red indicates an increase; gray indicates not detected).