
- Title
-
Immune gene variation associated with chromosome-scale differences among individual zebrafish genomes
- Authors
- McConnell, S.C., Hernandez, K.M., Andrade, J., de Jong, J.L.O.
- Source
- Full text @ Sci. Rep.
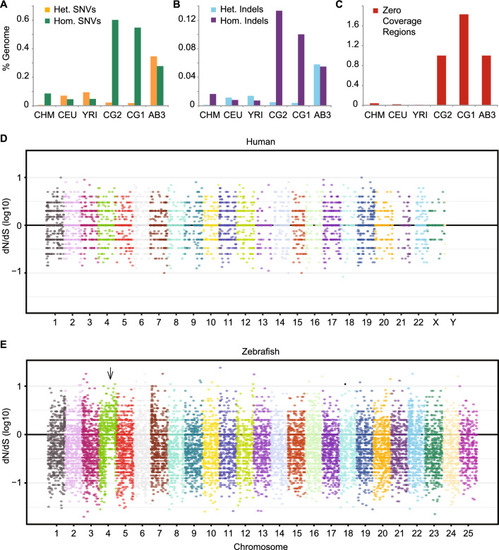
Sequence variants and evidence of positive selection. (A) Single nucleotide variants (SNVs) or (B) small insertions/deletions (Indels) were identified using GATK haplotype caller and reported as a percentage of each genome. Both heterozygous (Het.) and homozygous (Hom.) variants are shown. (C) Percentage of base pairs in each genome covered by Zero Coverage Regions (ZCRs), defined as no reads mapped over ≥ 2 kb intervals. Manhattan plots of the ratio of non-synonymous to synonymous mutations (dN/dS) per allele for three human (D) or zebrafish (E) individuals. Each dot represents the log10 ratio of nonsynonymous to synonymous SNVs of one gene with variants. The black horizontal line at ‘0’ indicates alleles under neutral selection, i.e. those having a dN/dS ratio of 1 (the ratio for each allele is plotted on a log10 scale). A large fraction of genes throughout the right arm of zebrafish chromosome 4 (indicated by arrow) have evidence of positive selection (dN/dS > 1). CHM, CEU, and YRI are samples from the 1000 Genomes Project representing: a haploid complete hydatidiform mole, CHM1; Utah Resident (CEPH) with European Ancestry, NA12878; Yoruba in Ibadan, Nigeria, 19240; respectively. CG2 and CG1 are clonal (homozygous diploid) zebrafish lines, and AB3 is a partially inbred fish, all on the AB genetic background. |
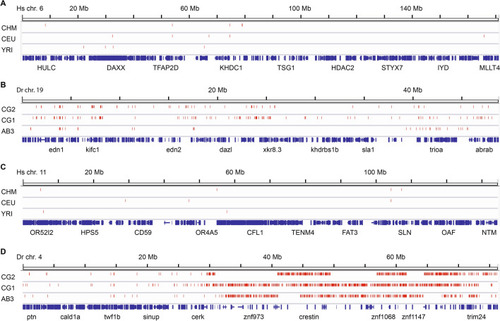
Chromosomal distribution of zero coverage regions. Comparison of (A) human chromosome 6 (location of the human MHC locus), (B) zebrafish chromosome 19 (location of the zebrafish core MHC locus), (C) human chromosome 11 (location of 4 out of 25 human NLR gene family members), and (D) zebrafish chromosome 4 (location of over 300 zebrafish NLR genes). Zero coverage regions (no mapped reads over ≥ 2 kb intervals) are displayed in red. Gene annotation is shown in blue with a small number of genes labeled. ZCRs are found more densely in zebrafish chromosomes compared with human chromosomes and a large concentration of ZCRs is distributed throughout the heterochromatic right arm of zebrafish chromosome 4 with evidence of haplotypic differences between individuals. |
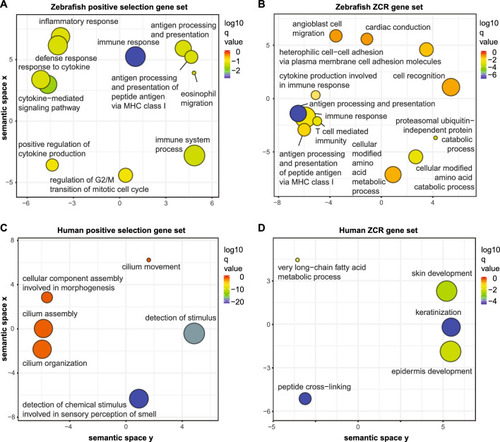
Gene annotation enrichment analysis. Genes with evidence of positive selection (dN/dS > 1) or genes with at least one exon overlapping zero coverage regions (ZCRs, without any mapped reads over ≥ 2 kb intervals) were analyzed using GO (Gene Ontology) annotation to identify genes enriched in specific biological processes. GO enrichments were summarized using REVIGO24. Remaining terms after adjustment for redundancy are represented as scatterplots, following semantic similarities. Bubble color indicates the log10 q-value/enrichment (see legend on right) and bubble size indicates the GO term frequency, where smaller bubbles imply more specific terms. Data are shown for zebrafish genes under positive selection (A), zebrafish genes overlapping ZCRs (B), human genes under positive selection (C), and human genes overlapping ZCRs (D). Lists of enriched pathways with genes are provided in Table S4. |
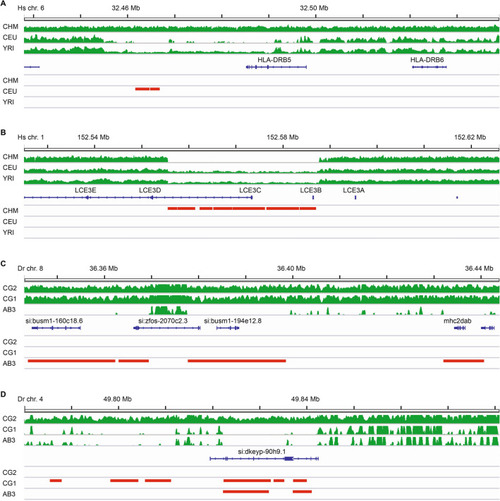
Zero coverage regions highlight unique haplotypes. Selected 100 kb region plots including (A) HLA-DRB5 gene on human chromosome 6, (B) LCE3C gene on human chromosome 1, (C) mhc2dab gene on zebrafish chromosome 8, and (D) NLR gene (si:dkeyp-90h9.1) on zebrafish chromosome 4. Plots show mapped sequence read coverage across each region in green. Zero Coverage Regions (no mapped reads over ≥ 2 kb intervals) are displayed in red. Representative examples shown here were selected due to different patterns of coverage for individuals of the same species, indicating the presence of an alternative haplotype at that locus. We note similar findings indicating alternative haplotypes for additional immune gene loci throughout the zebrafish genome, including MHC Class I genes on chromosome 25 and NLR genes on chromosomes beyond chromosome 4, as highlighted in Fig. S2. |
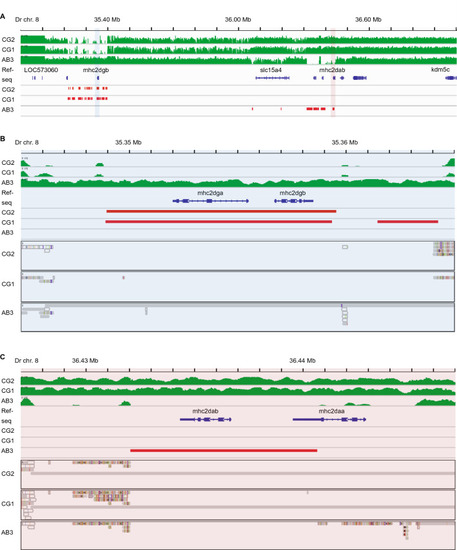
MHC Class II genes on zebrafish chromosome 8. (A) Read coverage across the zebrafish Class II MHC locus shows marked variability between individuals. Unlike the CG2 and CG1 fish, the AB3 zebrafish genome has a cluster of zero coverage regions (ZCRs, without any mapped reads over ≥ 2 kb intervals) in the region surrounding mhc2dab (highlighted in light red). In contrast, the CG2 and CG1 fish have a cluster of ZCRs in the region surrounding mhc2dgb (highlighted in light blue). (B) A detailed view of the region highlighted above in light blue (A) showing ZCRs overlapping the neighboring mhc2dgb and mhc2dga genes. (C) A detailed view of the region highlighted above in light red (A) showing ZCRs overlapping the neighboring mhc2dab and mhc2daa genes. Read coverage is depicted in green, ZCRs are in red, and scaffolds from Discovar assemblies that align to the reference genome are grey. |

MHC and NLR genes associated with zero coverage regions (ZCRs). The percentage of (A) major histocompatibility complex (MHC) genes, (B) NOD-like receptor (NLR) genes, or (C) all genes in each of three human or zebrafish genomes, with at least one exon overlapping ZCRs. ‘Comb.’ refers to the combined list of genes from all three individuals that overlaps with ZCRs. CHM, CEU, and YRI are human samples from the 1000 Genomes Project representing: a haploid complete hydatidiform mole, CHM1; Utah Resident (CEPH) with European Ancestry, NA12878; Yoruba in Ibadan, Nigeria, 19240; respectively. CG2 and CG1 are clonal zebrafish lines, and AB3 is a partially inbred fish, all on the AB genetic background (the gene lists used for (A,B) are found in Table S9. Total number of zebrafish MHC genes = 42; total number of human MHC genes = 37. Total number of zebrafish NLR genes = 3689. The data used to make the bar graphs are found in Table S11). |