
Figure 3
- ID
- ZDB-FIG-230518-5
- Publication
- McConnell et al., 2023 - Immune gene variation associated with chromosome-scale differences among individual zebrafish genomes
- Other Figures
- All Figure Page
- Back to All Figure Page
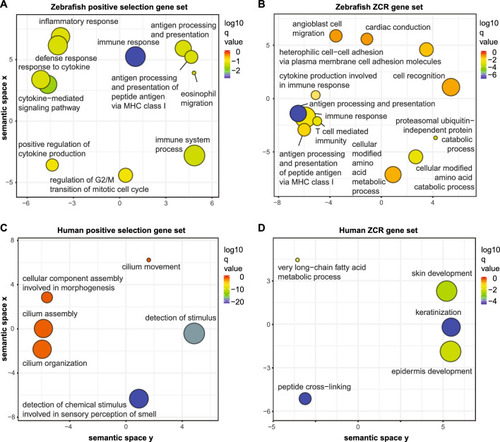
Gene annotation enrichment analysis. Genes with evidence of positive selection (dN/dS > 1) or genes with at least one exon overlapping zero coverage regions (ZCRs, without any mapped reads over ≥ 2 kb intervals) were analyzed using GO (Gene Ontology) annotation to identify genes enriched in specific biological processes. GO enrichments were summarized using REVIGO24. Remaining terms after adjustment for redundancy are represented as scatterplots, following semantic similarities. Bubble color indicates the log10 q-value/enrichment (see legend on right) and bubble size indicates the GO term frequency, where smaller bubbles imply more specific terms. Data are shown for zebrafish genes under positive selection (A), zebrafish genes overlapping ZCRs (B), human genes under positive selection (C), and human genes overlapping ZCRs (D). Lists of enriched pathways with genes are provided in Table S4. |