
|
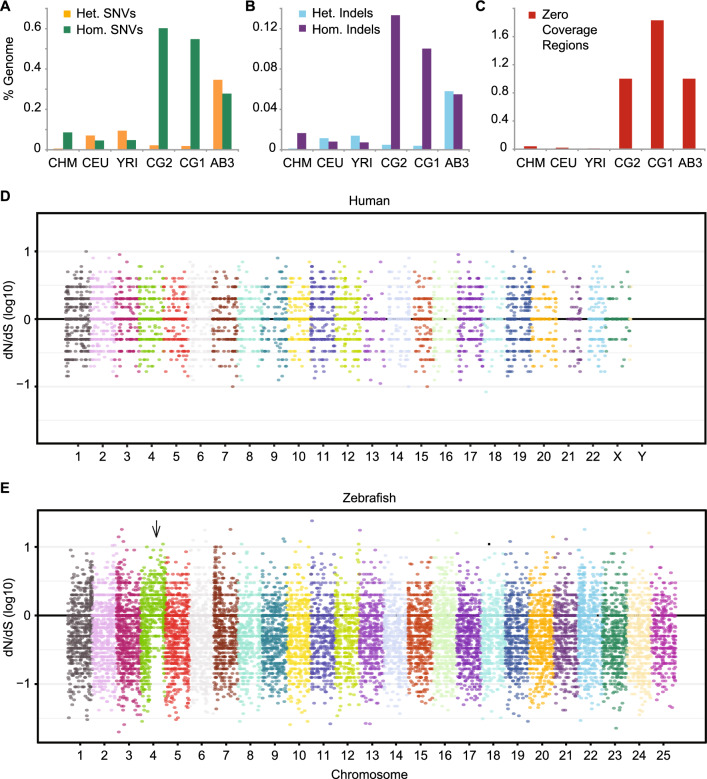
Figure 1
Sequence variants and evidence of positive selection. (A) Single nucleotide variants (SNVs) or (B) small insertions/deletions (Indels) were identified using GATK haplotype caller and reported as a percentage of each genome. Both heterozygous (Het.) and homozygous (Hom.) variants are shown. (C) Percentage of base pairs in each genome covered by Zero Coverage Regions (ZCRs), defined as no reads mapped over ≥ 2 kb intervals. Manhattan plots of the ratio of non-synonymous to synonymous mutations (dN/dS) per allele for three human (D) or zebrafish (E) individuals. Each dot represents the log10 ratio of nonsynonymous to synonymous SNVs of one gene with variants. The black horizontal line at ‘0’ indicates alleles under neutral selection, i.e. those having a dN/dS ratio of 1 (the ratio for each allele is plotted on a log10 scale). A large fraction of genes throughout the right arm of zebrafish chromosome 4 (indicated by arrow) have evidence of positive selection (dN/dS > 1). CHM, CEU, and YRI are samples from the 1000 Genomes Project representing: a haploid complete hydatidiform mole, CHM1; Utah Resident (CEPH) with European Ancestry, NA12878; Yoruba in Ibadan, Nigeria, 19240; respectively. CG2 and CG1 are clonal (homozygous diploid) zebrafish lines, and AB3 is a partially inbred fish, all on the AB genetic background.