
|
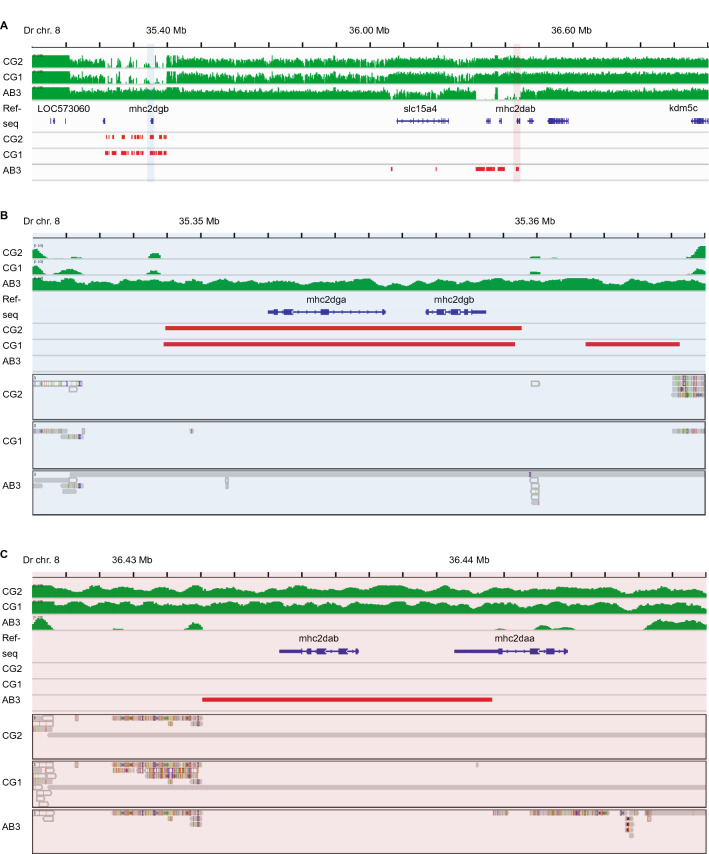
Figure 5
MHC Class II genes on zebrafish chromosome 8. (A) Read coverage across the zebrafish Class II MHC locus shows marked variability between individuals. Unlike the CG2 and CG1 fish, the AB3 zebrafish genome has a cluster of zero coverage regions (ZCRs, without any mapped reads over ≥ 2 kb intervals) in the region surrounding mhc2dab (highlighted in light red). In contrast, the CG2 and CG1 fish have a cluster of ZCRs in the region surrounding mhc2dgb (highlighted in light blue). (B) A detailed view of the region highlighted above in light blue (A) showing ZCRs overlapping the neighboring mhc2dgb and mhc2dga genes. (C) A detailed view of the region highlighted above in light red (A) showing ZCRs overlapping the neighboring mhc2dab and mhc2daa genes. Read coverage is depicted in green, ZCRs are in red, and scaffolds from Discovar assemblies that align to the reference genome are grey.