
|
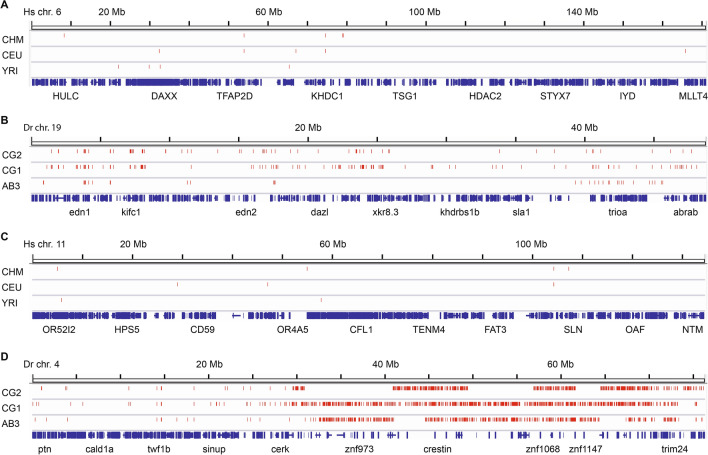
Figure 2
Chromosomal distribution of zero coverage regions. Comparison of (A) human chromosome 6 (location of the human MHC locus), (B) zebrafish chromosome 19 (location of the zebrafish core MHC locus), (C) human chromosome 11 (location of 4 out of 25 human NLR gene family members), and (D) zebrafish chromosome 4 (location of over 300 zebrafish NLR genes). Zero coverage regions (no mapped reads over ≥ 2 kb intervals) are displayed in red. Gene annotation is shown in blue with a small number of genes labeled. ZCRs are found more densely in zebrafish chromosomes compared with human chromosomes and a large concentration of ZCRs is distributed throughout the heterochromatic right arm of zebrafish chromosome 4 with evidence of haplotypic differences between individuals.